
With Vertica’s Management Console, I have everything I need at my fingertips to manage and monitor my Vertica clusters and databases. Whether that be investigating query performance issues, checking on the health of the cluster’s nodes, running the Database Designer or marveling at the volume of data being ingested by the Vertica Scheduler from a Kafka broker:
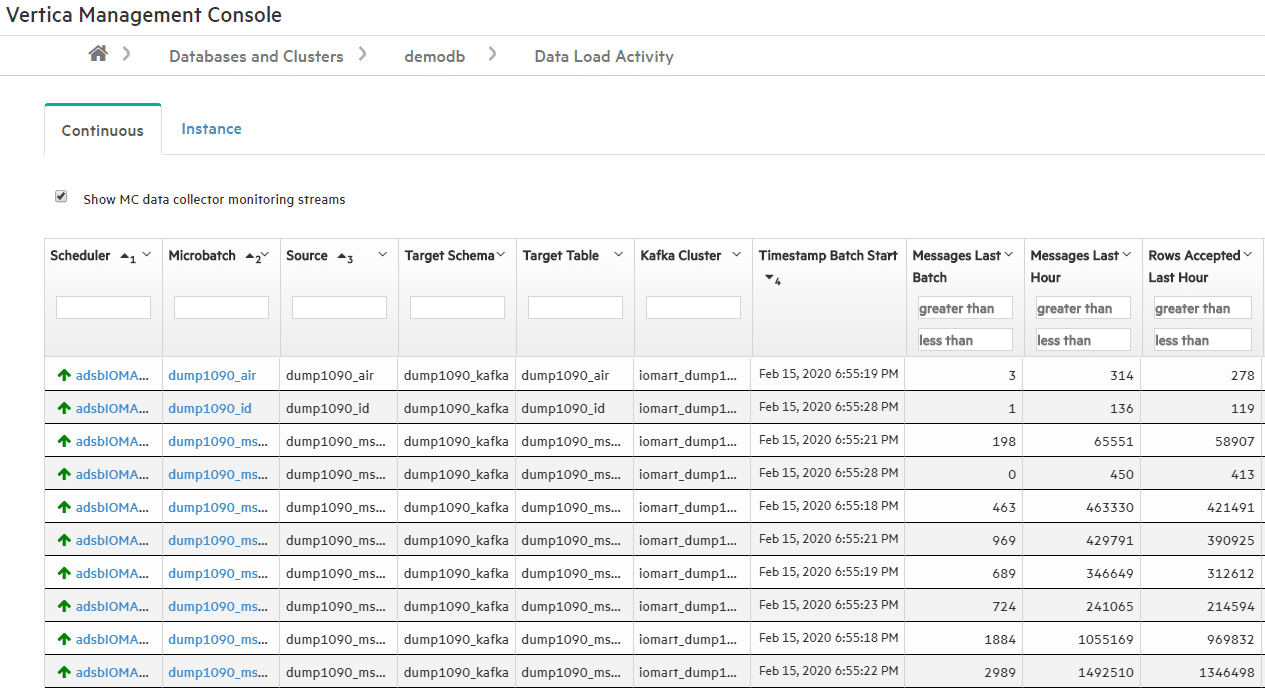
However, I would also like to be able to monitor other aspects of the ecosystem. As a case in point, for those who have been following my blog post series where I talk about using Vertica to track commercial aircraft in real time, this has now grown into a more permanent live demo of some of Vertica’s capabilities. This includes streaming 100m messages per day from 5 “radars” dotted around the globe via Kafka and on into Vertica in 10-second micro batches. From Vertica, we then have a whole raft of live demos. Including integration with 3rd-party tools to visualize both live and historic data with sub-second responses over a database that currently stores 50bn records (as of February 2020).
But this blog post is not about what this Flight Tracking can do, but more about what happens when something breaks, or doesn’t do quite what it is expected of it.
Many of my colleagues have come to rely on being able to fire up a web browser, pull out their tablet or mobile and start their Tableau Mobile app, or open a Jupyter Notebook to show off Vertica with the Flight Tracking demo to prospects and customers at trade shows, conferences or at the bar in the airport departure lounge 😉 .
The problem being, that the Flight Tracking demo has not been set up as a production-ready, highly visible application. This is just a demo that started off as a hobby project – certainly not aimed at being a real solution for aircraft navigation systems, pilots and air traffic controllers to manage the safety of aircraft, crew, passengers and the general population!
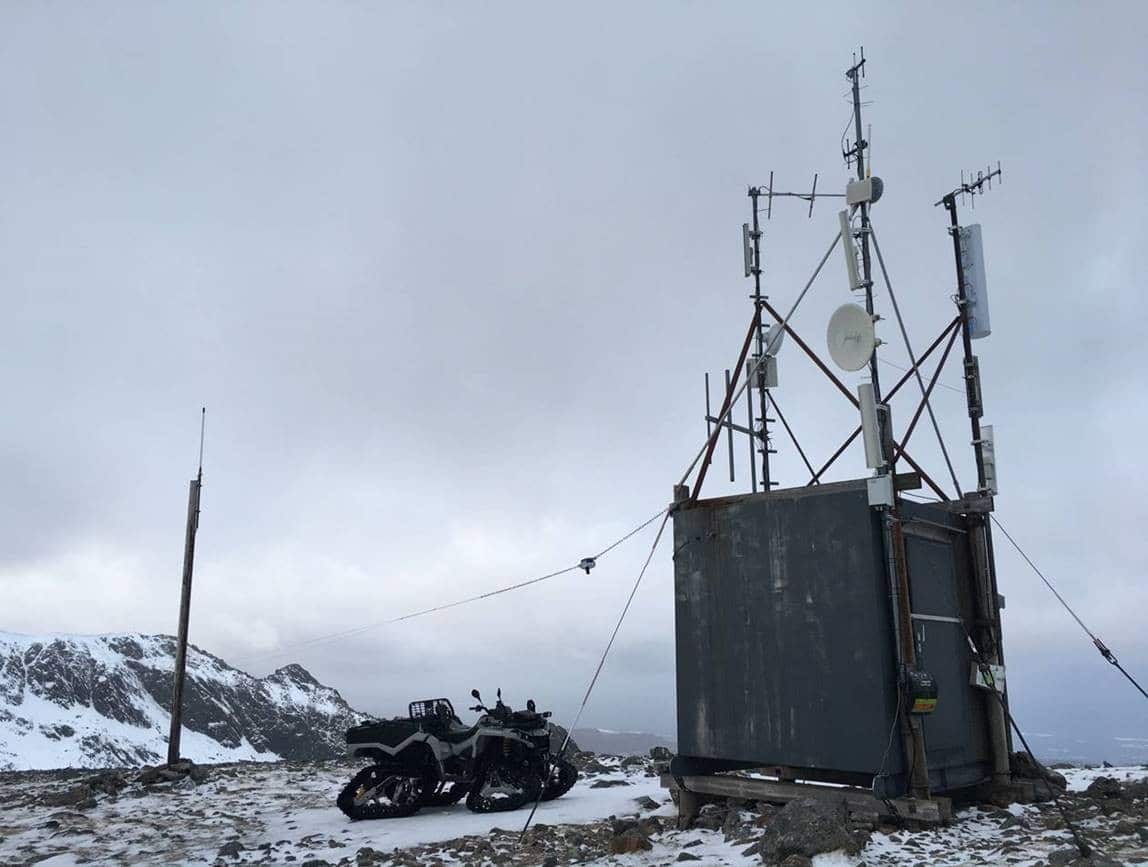
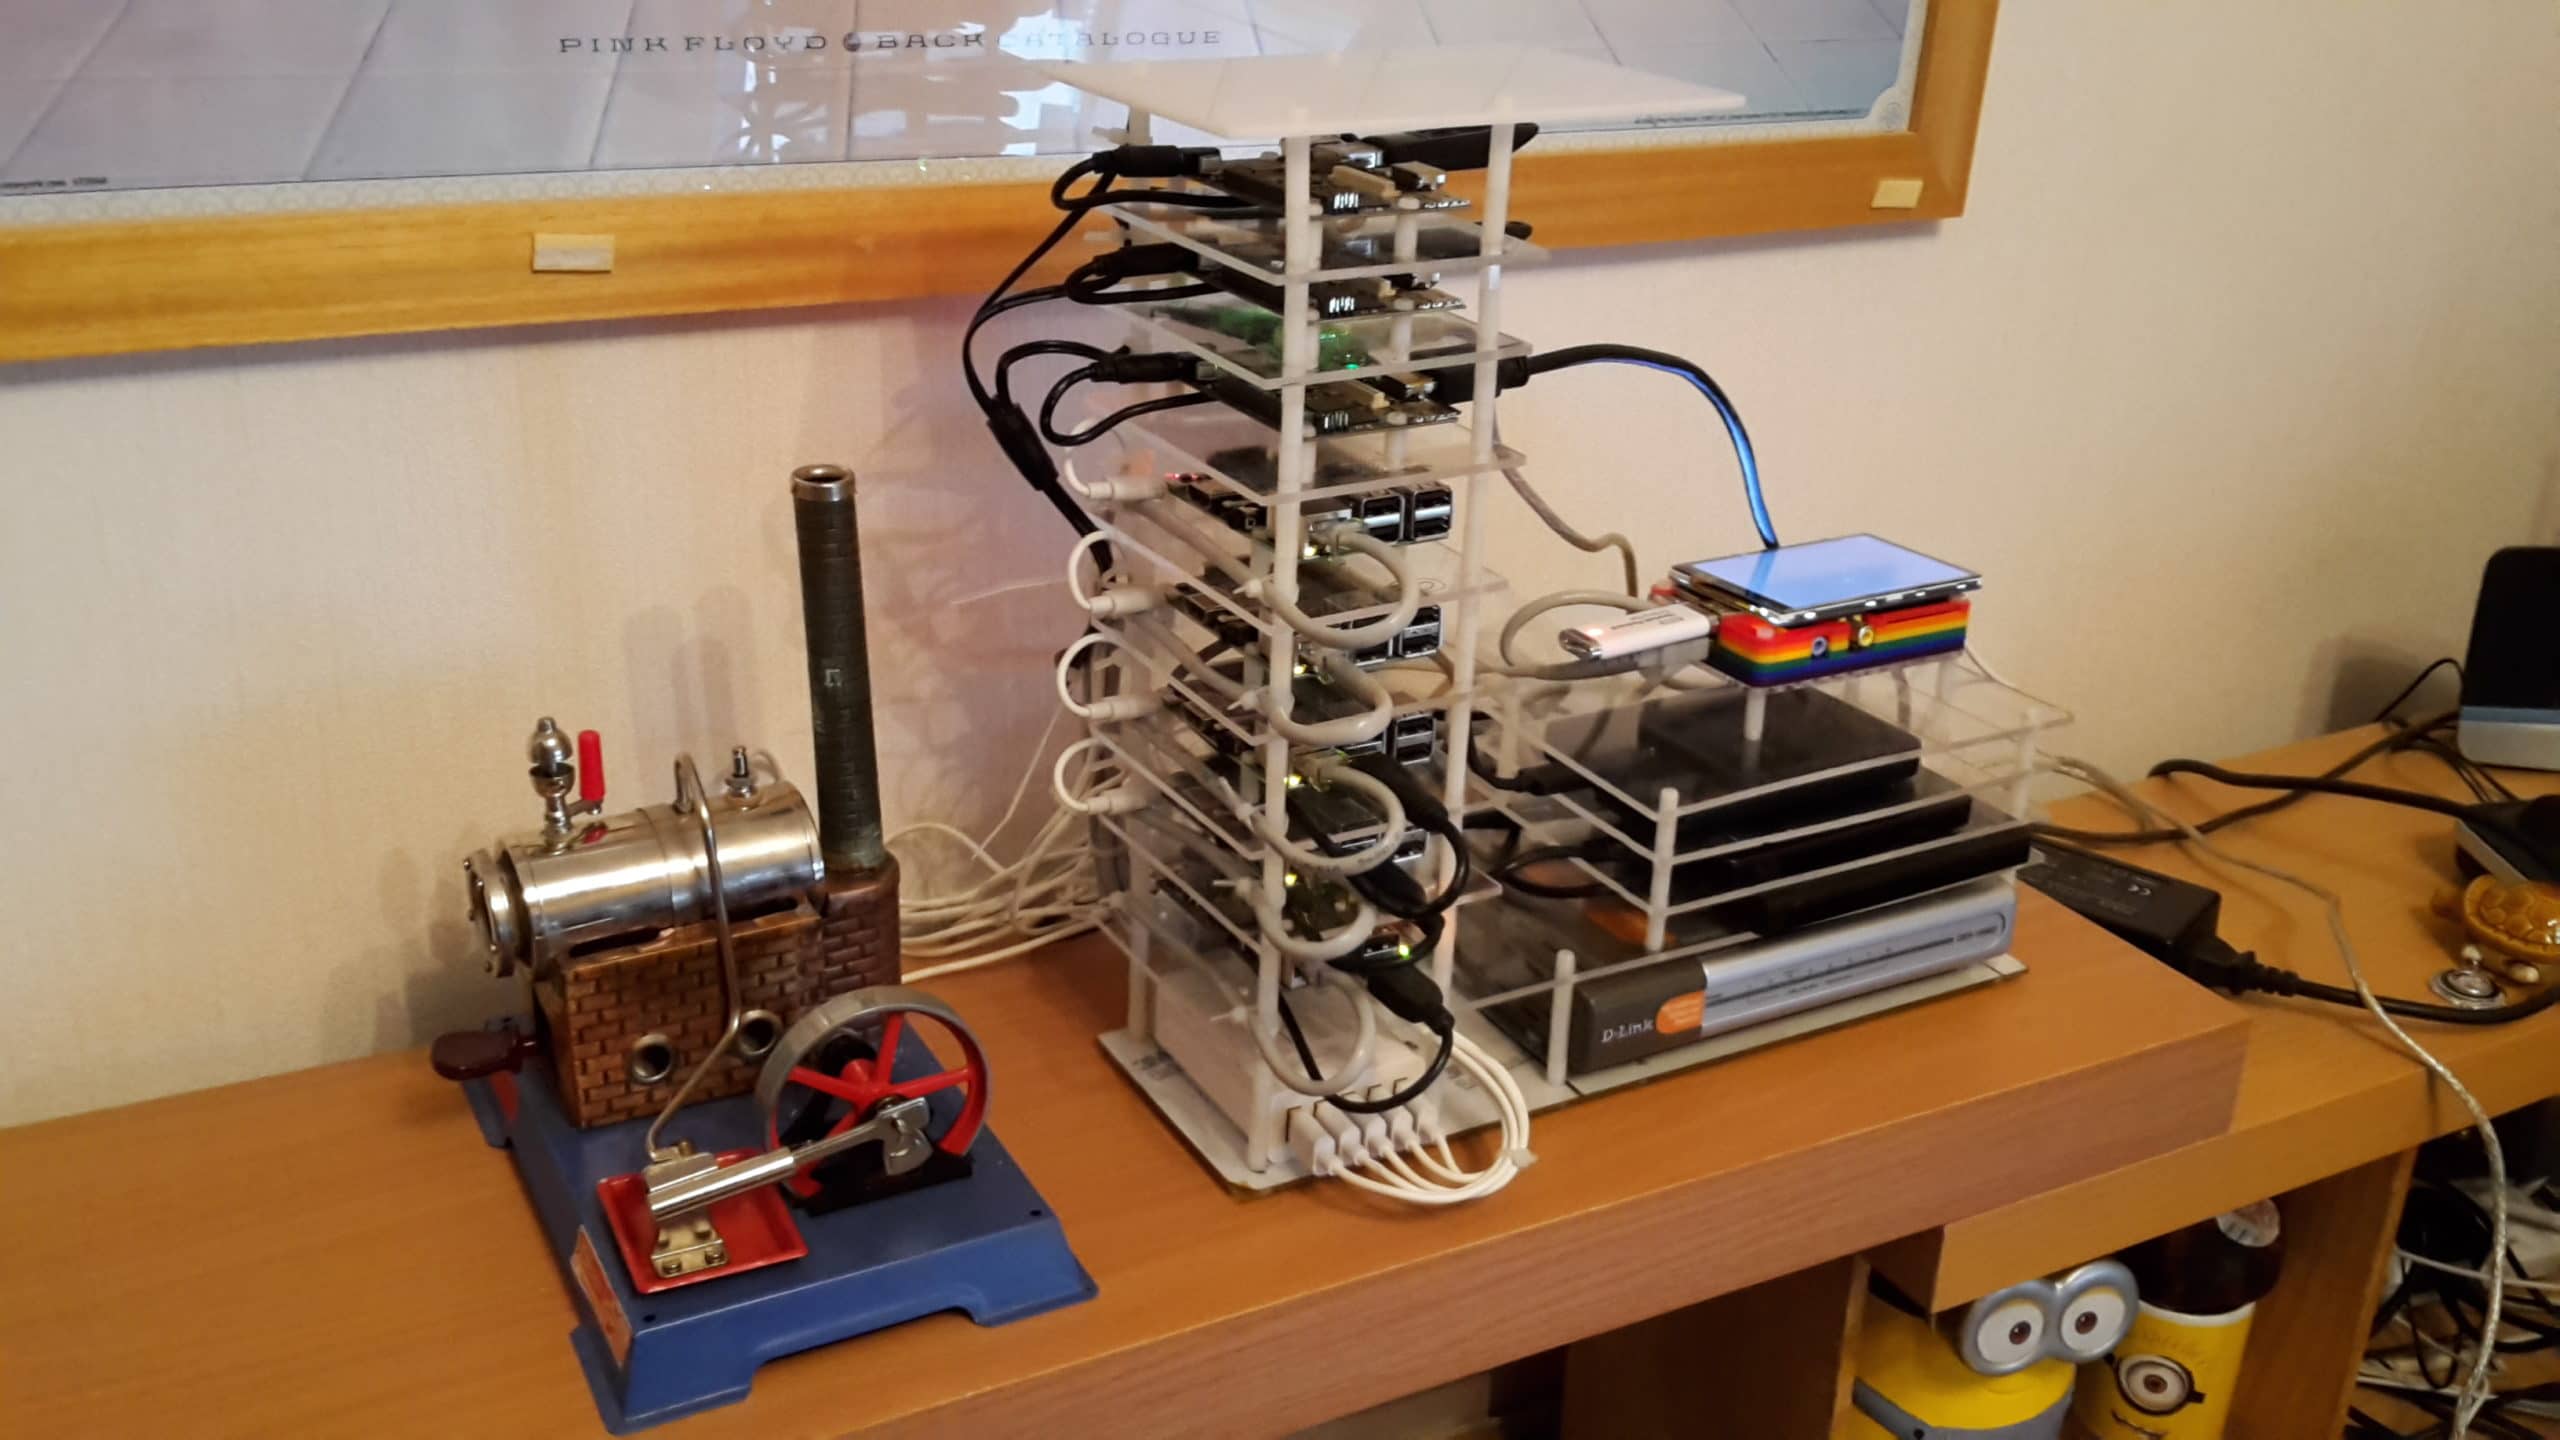
With so many moving parts such as Raspberry PIs and antennae at the top of a mountain, something is bound to break at some point. Before, the first we knew about it was when we attempted to run a demo and it didn’t work.
So when we recently announced the availability of the Grafana Data Source Plugin for Vertica, I had to check this out.
Following the simple instructions on how to get Grafana and the plugin installed, I was very quickly able to setup monitoring of the Kafka data feeds from the five primary radars.
I won’t repeat everything here, as the installation and configuration of Grafana and the plugin are well documented.
What’s more, by setting up the monitoring, I was able to not only get email notifications when one of the radars went offline, but it enabled me to observe other features of the data that I had not previously considered.
I’ll touch on how simple it was to setup the monitoring of the radars, and highlight some of these interesting observations – which prompted me to investigate other aspects of the Flight Tracking demo.
Without going into great detail here (this is covered in more detail in the Flight Tracking blog post series I mentioned earlier), what I needed to monitor was quite simple.
The five primary radars capture positional data of aircraft within their catchment area (200-300KM2) several times per second. This data is decoded, and via a simple ETL application fed into a series of Apache Kafka topics. A single Vertica database has a Scheduler configured to pick up these messages from Kafka every 10 seconds, and load them into a series of Vertica tables.
As these radars can go offline often without warning, I needed to find a way to monitor the incoming data feeds into Vertica, and raise an alert if a radar appeared to have gone offline.
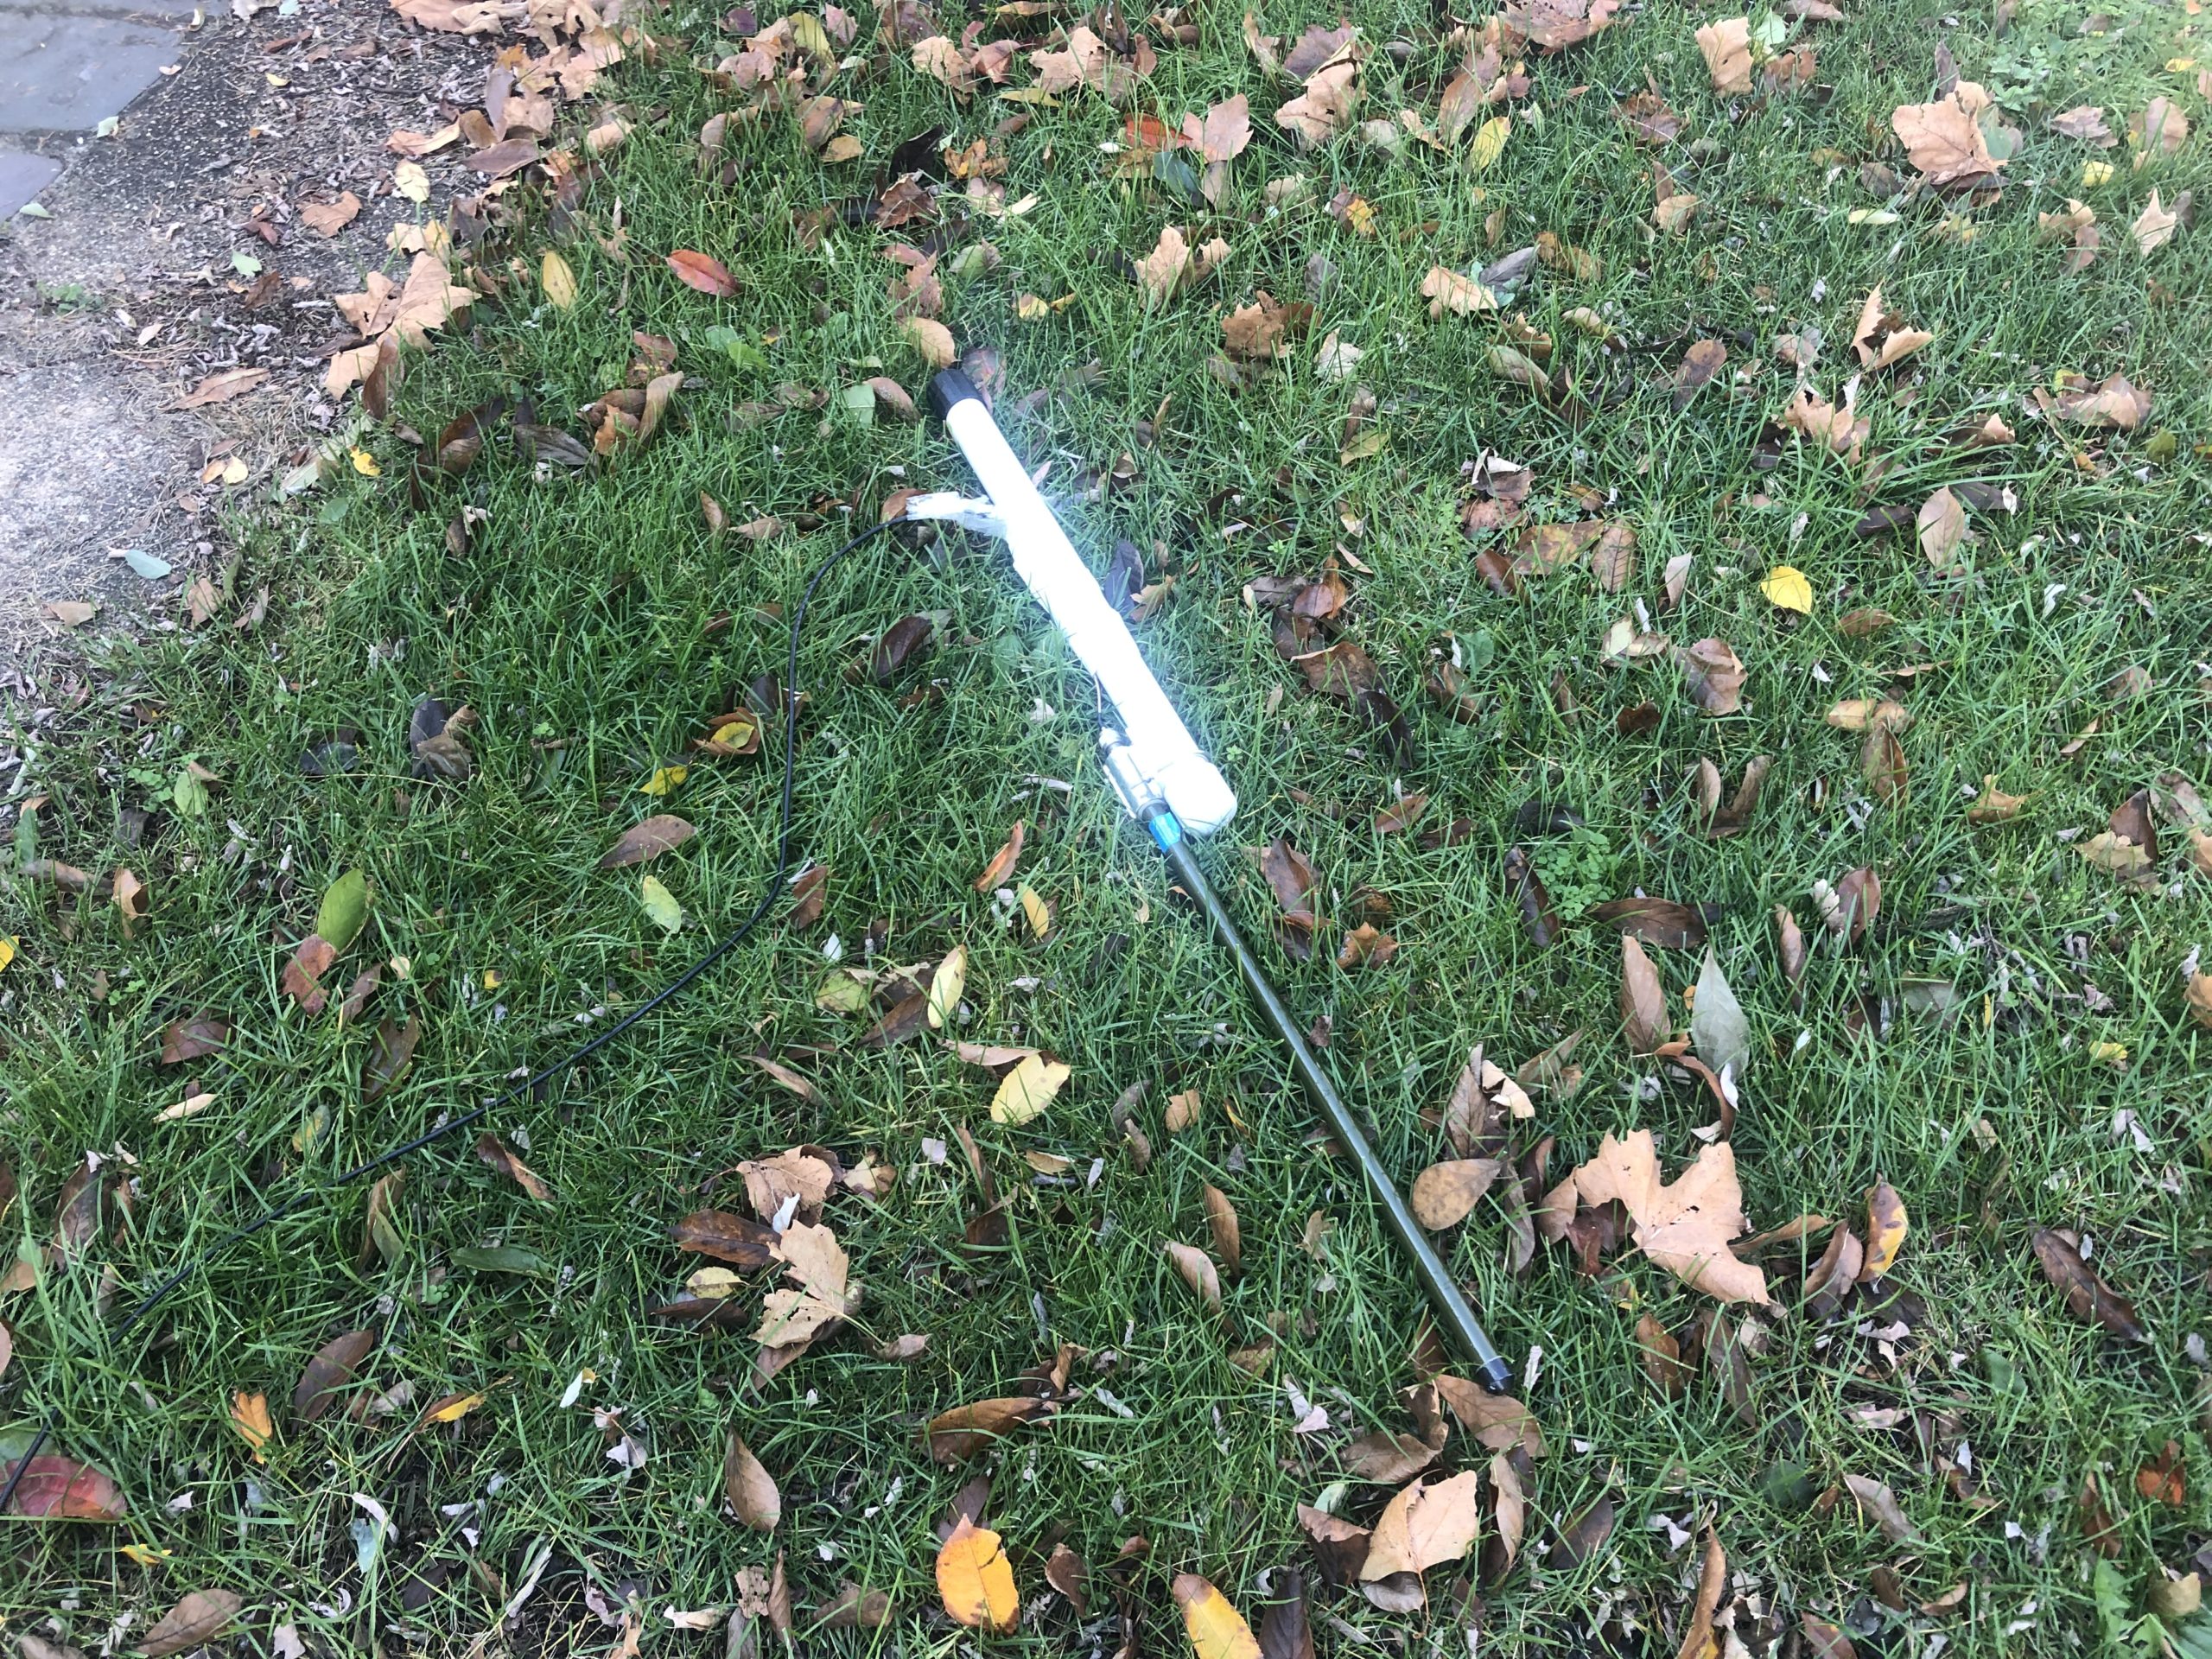
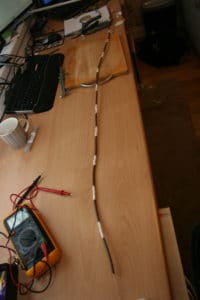
Over the years, I have observed a number of instances when a radar has gone offline. These have included storms blowing the JFK antenna off the roof, power failures in Geneva and damaged collinear antenna cables. In all such instances, what I needed was to know that a radar had gone offline, and then start investigating the cause (and get the ladders out!).
In a previous life, I had intensively used the Nagios open-source monitoring tool. This could easily have been used here. However, with the Grafana plugin for Vertica, setting up a monitor for this Flight Tracking project couldn’t have been easier. I certainly did not have to write a 200-line bash shell script!
For example, adding a Grafana dashboard with its constituent panels took just minutes, and subsequent panels took seconds.
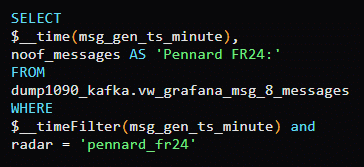
In the example below, I have added panels to monitor the number of records received by each of the five radars from a database view in Vertica. To simplify this, I am showing the code for just one of the Grafana Queries for the Pennard radar. The queries for the other radars being almost identical other than the radar name:
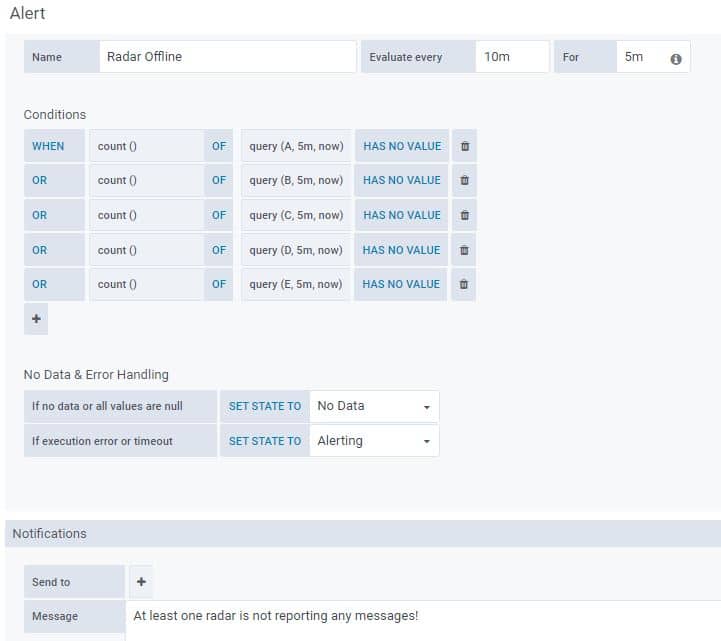
Within the Grafana Alerts section, I created a rule to notify me whenever the number of messages (count()) of the Query B, above, ) has no values for the 5 past minutes. I’ve removed the “Send To” line in the image below to prevent me being bombarded with emails from unscrupulous reprobates. 😉
This rule has been setup to run every 10 minutes. If the condition fails, it will send me an email with a message of “Radar Offline”
So, what does the first draft of the dashboard look like?
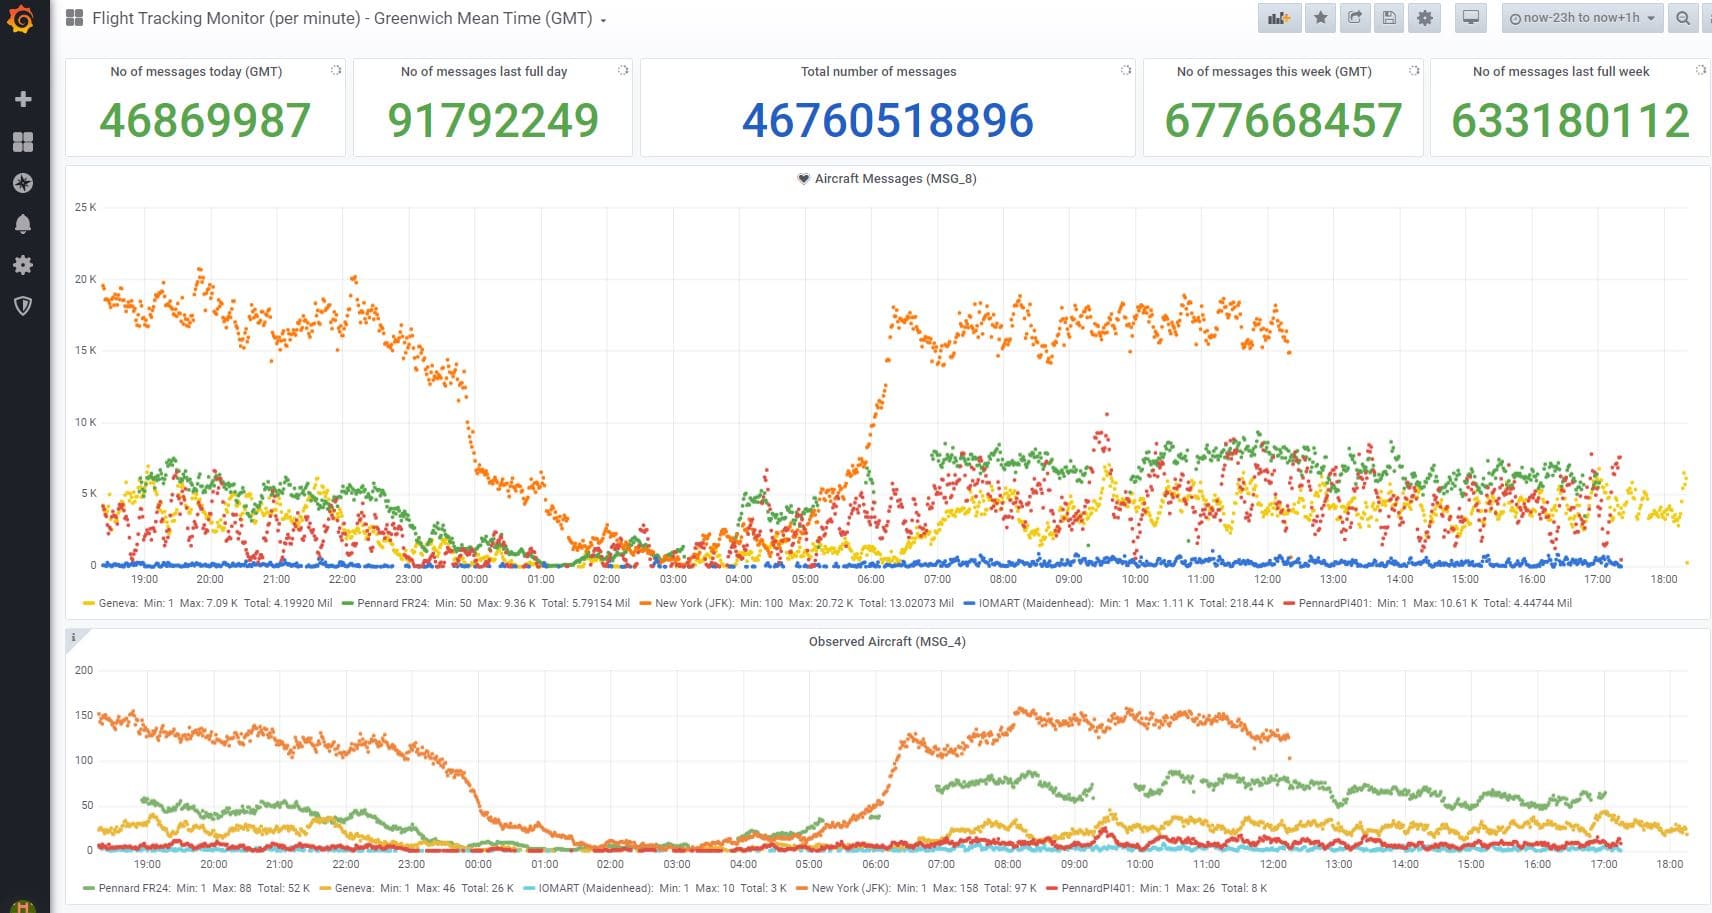
Here, you see seven panels.
At the top left, two panels report the number of messages received so far today, and the number received in the last full day. To the right, the number of messages so far this week, and the number of messages in the last full week.
Then, in the centre, the total number of flight-tracking messages stored in the database – currently at 46.7bn!
Below the five numeric-counter panels, we have the total number of messages (records) received from each of the five radars. As you can hopefully see, the JFK radar is reporting up to 20K messages per minute.
The lower panel (Observed Aircraft) is reporting the number of unique aircraft per minute. With each aircraft sending messages at least once per second, I only wanted to report the actual number of aircraft per minute, rather than the number of messages transmitted every minute. Here, JFK is reporting ~150 aircraft per minute.
You may be able to spot the timeframe, here reporting “now-23h” to “now+1h”. The reason behind this is that data is being stored in Vertica in GMT. (OK, if you must, let’s call it UTC.) However, let’s not forget who invented time. Although the Swiss make excellent time pieces, the “G” doesn’t stand for Geneva, rather it’s Greenwich – UK.
So, by reporting this dashboard using GMT, I need to look into the future one hour to report the Geneva data, my second radar. Then we have JFK (GMT -5 hours), and my UK-based radars. Thus the staggered lines on the right-hand side of the graph.
With regards to the alerting, I have recently had some problems with the Raspberry PIs in my home office.
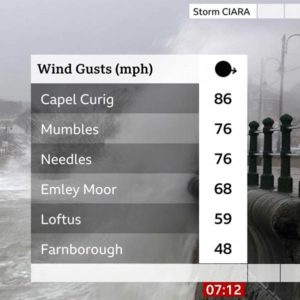
Although I had looked at installing the steam-powered UPS, this wasn’t set up in time for the recent storms that hit Wales, first, Ciara, then Storm Dennis! As such, we have suffered a number of power outages. 🙁
With data not being fed through to Vertica from the Pennard radar, Grafana picked up on the “warning” and “critical” states and in due course the “OK” state as it came back online.
In this instance there wasn’t much I could do about the power outage, other than getting the steam-power UPS fired up. 😉 But, had the outage been caused by an antenna falling off the roof or other system failure, I would have a notification from Grafana. I could have investigated and hopefully resolved the problem before it impacted my colleagues wanting to run a Flight Tracking demo.
Now I mentioned some of the other benefits, or at least observations from having set up this monitoring that I had not seen in the existing demo visualisations.
The first which I quite liked was the profile of flights during the day. Accepting there are aircraft in our skies 24×7, it was interesting to see how fewer aircraft were observed during the night by the (land-based) radars.
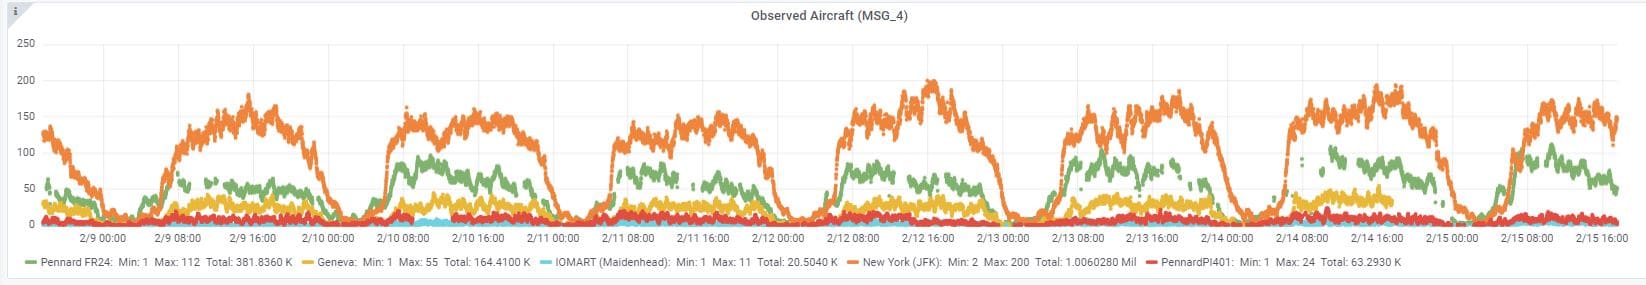
Although I have not yet investigated further, if you look closer, that first peak is for Sunday 9th February 2020. The number of aircraft gradually increases in the morning (~07:00) compared to the weekdays (Monday to Friday) where the number of aircraft increases more rapidly at that time, slowing again by Saturday.
I am no expert in this field, but this certainly makes an interesting observation that needs further investigation. It might be a perfect use case for Vertica’s Machine Learning and Predictive Analytics.
Another interesting observation, to me at least, was how one of my Raspberry PI radars, although I know suffered from the recent power outages, was showing that even though it was still powered, it was frequently failing to report data:
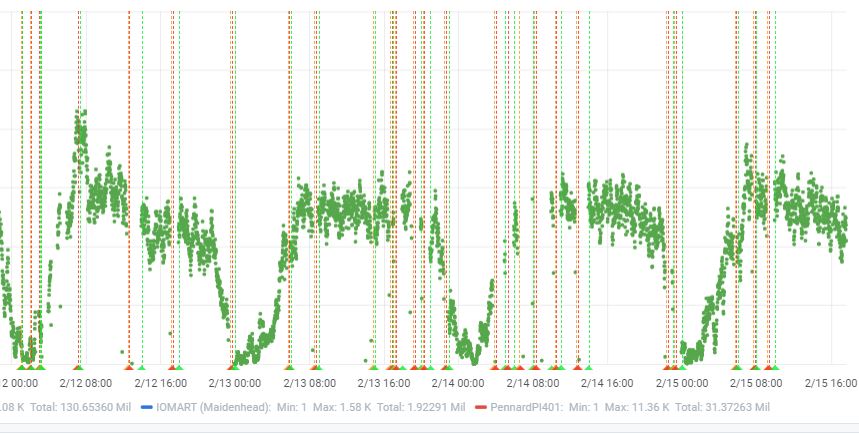
On further investigation, the Flight Tracking software installed on this radar had been configured to perform an automatic update. Normally, this would have been performed without any problems. However, due to some Linux library configuration issues, the upgrade was repeatedly failing. When not attempting to do the upgrade, the decode software was working perfectly fine.
I would have had a lot of difficulty spotting that problem, had it not been for this new monitoring and alerting.
Although early days, I can see that this Grafana data source plugin for Vertica could prove an extremely valuable asset.
I for one will be using it to make my life a little bit easier.
Mark Whalley
Vertica Technical Enablement Lead
(amateur flight tracking aficionado)
15th February 2020
About the Author
Mark Whalley
Manager, Vertica Education
From the early 1980s, Mark worked with Michael Stonebraker's Ingres RDBMS and then a number of column-store big data analytics technologies.
In 2016, he joined HPE Big Data Platform as a Systems Engineer specialising in Stonebraker’s Vertica.
In September 2017 he followed Vertica as it merged into Micro Focus – one of the world’s largest pure-play software companies.
He is passionate about technology and frequently delivers talks at the London, Cambridge and Munich Big Data & Machine Learning Meetups (of which he is the founder with its 4K+ members), the British Computer Society – Advanced Programming Specialist Group, Vertica Forums, the Institute for Analytics and Data Science at the University of Essex et al.
He is a technical blogger and author.