
verticapy.machine_learning.memmodel.cluster.BisectingKMeans
- class verticapy.machine_learning.memmodel.cluster.BisectingKMeans(clusters: Annotated[list | ndarray, 'Array Like Structure'], children_left: Annotated[list | ndarray, 'Array Like Structure'], children_right: Annotated[list | ndarray, 'Array Like Structure'], cluster_size: Annotated[list | ndarray, 'Array Like Structure'] | None = None, cluster_score: Annotated[list | ndarray, 'Array Like Structure'] | None = None, p: int = 2)
InMemoryModelimplementation ofBisectingKMeans.Parameters
- clusters: ArrayLike
listof the model’s cluster centers.- children_left: ArrayLike
A list of node IDs, where
children_left[i]is the node ID of the left child of node i.- children_right: ArrayLike
A list of node IDs, where
children_right[i]is the node ID of the right child of node i.- cluster_size: ArrayLike
A list of sizes, where
cluster_size[i]is the number of elements in node i.- cluster_score: ArrayLike
A list of scores, where
cluster_score[i]is the score for internal node i. The score is the ratio between the within -cluster sum of squares of the node and the total within-cluster sum of squares.- p: int, optional
The
pcorresponding to one of thep-distances.
Attributes
Attributes are identical to the input parameters, followed by an underscore (‘_’).
Examples
Initalization
Import the required module.
from verticapy.machine_learning.memmodel.cluster import BisectingKMeans
A
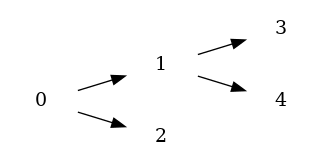
BisectingKMeansmodel is defined by itsclusterscentroids, left and right child node id’s of given node. In this example, we will use the following:clusters = [ [0.5, 0.6], [1, 2], [100, 200], [10, 700], [-100, -200], ] children_left = [1, 3, None, None, None] children_right = [2, 4, None, None, None]
Let’s create a
BisectingKMeansmodel.model_bkm = BisectingKMeans(clusters, children_left, children_right)
Create a dataset.
data = [[2, 3]]
Making In-Memory Predictions
Use
predict()method to do predictions.model_bkm.predict(data)[0] Out[7]: 4
Use
predict_proba()method to compute the predicted probabilities for each cluster.model_bkm.predict_proba(data) Out[8]: array([[0.32996436, 0.66034105, 0.00424426, 0.00133974, 0.00411059]])
Use
transform()method to compute the distance from each cluster.model_bkm.transform(data) Out[9]: array([[ 2.83019434, 1.41421356, 220.02954347, 697.04590954, 227.18494668]])
Use
to_graphviz()method to generate code for a Graphviz tree.model_bkm.to_graphviz() Out[10]: 'digraph Tree {\ngraph [rankdir = "LR"];\n0 [label="0", shape="none"]\n0 -> 1 [label=""]\n0 -> 2 [label=""]\n1 [label="1", shape="none"]\n1 -> 3 [label=""]\n1 -> 4 [label=""]\n2 [label="2", shape="none"]\n3 [label="3", shape="none"]\n4 [label="4", shape="none"]\n}'
Use
plot_tree()method to draw the input tree.model_bkm.plot_tree()
Note
plot_tree()requires the Graphviz module.Deploy SQL Code
Let’s use the following column names:
cnames = ['col1', 'col2']
Use
predict_sql()method to get the SQL code needed to deploy the model using its attributes.model_bkm.predict_sql(cnames) Out[12]: '(CASE WHEN col1 IS NULL OR col2 IS NULL THEN NULL ELSE (CASE WHEN POWER(POWER(col1 - 1.0, 2) + POWER(col2 - 2.0, 2), 1/2) < POWER(POWER(col1 - 100.0, 2) + POWER(col2 - 200.0, 2), 1/2) THEN (CASE WHEN POWER(POWER(col1 - 10.0, 2) + POWER(col2 - 700.0, 2), 1/2) < POWER(POWER(col1 - -100.0, 2) + POWER(col2 - -200.0, 2), 1/2) THEN 3 ELSE 4 END) ELSE 2 END) END)'
Use
predict_proba_sql()method to get the SQL code needed to deploy the model that computes predicted probabilities.model_bkm.predict_proba_sql(cnames) Out[13]: ['(CASE WHEN POWER(POWER(col1 - 0.5, 2) + POWER(col2 - 0.6, 2), 1 / 2) = 0 THEN 1.0 ELSE 1 / (POWER(POWER(col1 - 0.5, 2) + POWER(col2 - 0.6, 2), 1 / 2)) / (1 / (POWER(POWER(col1 - 0.5, 2) + POWER(col2 - 0.6, 2), 1 / 2)) + 1 / (POWER(POWER(col1 - 1.0, 2) + POWER(col2 - 2.0, 2), 1 / 2)) + 1 / (POWER(POWER(col1 - 100.0, 2) + POWER(col2 - 200.0, 2), 1 / 2)) + 1 / (POWER(POWER(col1 - 10.0, 2) + POWER(col2 - 700.0, 2), 1 / 2)) + 1 / (POWER(POWER(col1 - -100.0, 2) + POWER(col2 - -200.0, 2), 1 / 2))) END)', '(CASE WHEN POWER(POWER(col1 - 1.0, 2) + POWER(col2 - 2.0, 2), 1 / 2) = 0 THEN 1.0 ELSE 1 / (POWER(POWER(col1 - 1.0, 2) + POWER(col2 - 2.0, 2), 1 / 2)) / (1 / (POWER(POWER(col1 - 0.5, 2) + POWER(col2 - 0.6, 2), 1 / 2)) + 1 / (POWER(POWER(col1 - 1.0, 2) + POWER(col2 - 2.0, 2), 1 / 2)) + 1 / (POWER(POWER(col1 - 100.0, 2) + POWER(col2 - 200.0, 2), 1 / 2)) + 1 / (POWER(POWER(col1 - 10.0, 2) + POWER(col2 - 700.0, 2), 1 / 2)) + 1 / (POWER(POWER(col1 - -100.0, 2) + POWER(col2 - -200.0, 2), 1 / 2))) END)', '(CASE WHEN POWER(POWER(col1 - 100.0, 2) + POWER(col2 - 200.0, 2), 1 / 2) = 0 THEN 1.0 ELSE 1 / (POWER(POWER(col1 - 100.0, 2) + POWER(col2 - 200.0, 2), 1 / 2)) / (1 / (POWER(POWER(col1 - 0.5, 2) + POWER(col2 - 0.6, 2), 1 / 2)) + 1 / (POWER(POWER(col1 - 1.0, 2) + POWER(col2 - 2.0, 2), 1 / 2)) + 1 / (POWER(POWER(col1 - 100.0, 2) + POWER(col2 - 200.0, 2), 1 / 2)) + 1 / (POWER(POWER(col1 - 10.0, 2) + POWER(col2 - 700.0, 2), 1 / 2)) + 1 / (POWER(POWER(col1 - -100.0, 2) + POWER(col2 - -200.0, 2), 1 / 2))) END)', '(CASE WHEN POWER(POWER(col1 - 10.0, 2) + POWER(col2 - 700.0, 2), 1 / 2) = 0 THEN 1.0 ELSE 1 / (POWER(POWER(col1 - 10.0, 2) + POWER(col2 - 700.0, 2), 1 / 2)) / (1 / (POWER(POWER(col1 - 0.5, 2) + POWER(col2 - 0.6, 2), 1 / 2)) + 1 / (POWER(POWER(col1 - 1.0, 2) + POWER(col2 - 2.0, 2), 1 / 2)) + 1 / (POWER(POWER(col1 - 100.0, 2) + POWER(col2 - 200.0, 2), 1 / 2)) + 1 / (POWER(POWER(col1 - 10.0, 2) + POWER(col2 - 700.0, 2), 1 / 2)) + 1 / (POWER(POWER(col1 - -100.0, 2) + POWER(col2 - -200.0, 2), 1 / 2))) END)', '(CASE WHEN POWER(POWER(col1 - -100.0, 2) + POWER(col2 - -200.0, 2), 1 / 2) = 0 THEN 1.0 ELSE 1 / (POWER(POWER(col1 - -100.0, 2) + POWER(col2 - -200.0, 2), 1 / 2)) / (1 / (POWER(POWER(col1 - 0.5, 2) + POWER(col2 - 0.6, 2), 1 / 2)) + 1 / (POWER(POWER(col1 - 1.0, 2) + POWER(col2 - 2.0, 2), 1 / 2)) + 1 / (POWER(POWER(col1 - 100.0, 2) + POWER(col2 - 200.0, 2), 1 / 2)) + 1 / (POWER(POWER(col1 - 10.0, 2) + POWER(col2 - 700.0, 2), 1 / 2)) + 1 / (POWER(POWER(col1 - -100.0, 2) + POWER(col2 - -200.0, 2), 1 / 2))) END)']
Use
transform_sql()method to get the SQL code needed to deploy the model that computes distance from each cluster.model_bkm.transform_sql(cnames) Out[14]: ['POWER(POWER(col1 - 0.5, 2) + POWER(col2 - 0.6, 2), 1 / 2)', 'POWER(POWER(col1 - 1.0, 2) + POWER(col2 - 2.0, 2), 1 / 2)', 'POWER(POWER(col1 - 100.0, 2) + POWER(col2 - 200.0, 2), 1 / 2)', 'POWER(POWER(col1 - 10.0, 2) + POWER(col2 - 700.0, 2), 1 / 2)', 'POWER(POWER(col1 - -100.0, 2) + POWER(col2 - -200.0, 2), 1 / 2)']
Hint
This object can be pickled and used in any in-memory environment, just like SKLEARN models.
- __init__(clusters: Annotated[list | ndarray, 'Array Like Structure'], children_left: Annotated[list | ndarray, 'Array Like Structure'], children_right: Annotated[list | ndarray, 'Array Like Structure'], cluster_size: Annotated[list | ndarray, 'Array Like Structure'] | None = None, cluster_score: Annotated[list | ndarray, 'Array Like Structure'] | None = None, p: int = 2) None
Methods
__init__(clusters, children_left, children_right)Returns the model attributes.
plot_tree([pic_path])Draws the input tree.
predict(X)Predicts using the
BisectingKMeansmodel.Predicts the probability of each input to belong to the model clusters.
Returns the SQL code needed to deploy the model probabilities.
predict_sql(X)Returns the SQL code needed to deploy the
BisectingKMeansmodel using its attributes.set_attributes(**kwargs)Sets the model attributes.
to_graphviz([round_score, percent, ...])Returns the code for a Graphviz tree.
transform(X)Transforms and returns the distance to each cluster.
Transforms and returns the SQL distance to each cluster.
Attributes
Must be overridden in child class