Monitoring Cluster Nodes
For a visual overview of all cluster nodes, click the running database on the Databases and Clusters page and click the Manage tab at the bottom of the page to open the cluster status page.
The cluster status page displays the nodes in your cluster.
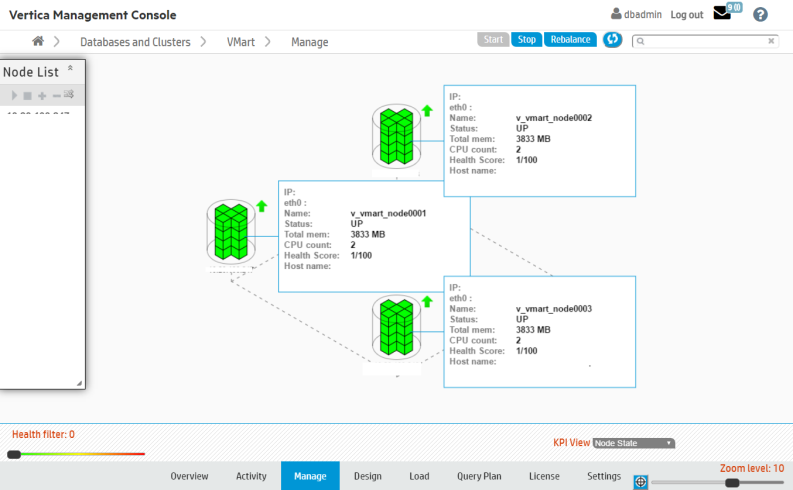
The appearance of the nodes indicate the following states:
- Healthy: The nodes appear green.
- Up: A small arrow to the right of the node points upward.
- Critical: The node appears yellow and displays a warning icon to the right.
- Down: The node appears red. To the right of the node, a red arrow points downwards.
- Unplugged: An orange outlet and plug icon appears to the right.
You can get information about a particular node by clicking it, an action that opens the node details page.
Filtering What You See
If you have a large cluster, where it might be difficult to view dozens to hundreds of nodes on the MC interface, you can filter what you see. The Zoom filter shows more or less detail on the cluster overall, and the Health Filter lets you view specific node activity; for example, you can slide the bar all the way to the right to show only nodes that are down. A message next to the health filter indicates how many nodes in the cluster are hidden from view.
On this page, you can perform the following actions on your database cluster:
- Add, remove and replace nodes
- Rebalance data across all nodes
- Stop or start (or restart) the database
- Refresh the view from information MC gathers from the production database
- View key performance indicators (KPI) on node state, CPU, memory, and storage utilization (see Monitoring Cluster Performance for details)
Starting, stopping, adding, and dropping nodes and rebalancing data across nodes works with the same functionality and restrictions as those same tasks performed through the Administration Tools.
If You Don't See What You Expect
If the cluster grid does not accurately reflect the current state of the database (for example if the MC interface shows a node in INITIALIZING state, but when you use the Administration Tools to View Database Cluster State, you see that all nodes are UP), click the Refresh button in the toolbar. Doing so forces MC to immediately synchronize with the agents and update MC with new data.
Don't press the F5 key, which redisplays the page using data from MC and ignores data from the agent. It can take several seconds for MC to enable all database action buttons.