Monitoring Cluster Performance
Key Performance Indicators (KPIs) are a type of performance measurement that let you quickly view the health of your database cluster through MC's Manage page. These metrics, which determine a node's color, make it easy for you to quickly identify problem nodes.
Metrics on the database are computed and averaged over the latest 30 seconds of activity and dynamically updated on the cluster grid.
How to Get Metrics on Your Cluster
To view metrics for a particular state, click the menu next to the KPI View label at the bottom of the Manage page, and select a state.
MC reports KPI scores for:
- Node state—(default view) shows node status (up, down, k-safety critical) by color; you can filter which nodes appear on the page by sliding the health filter from left to right
- CPU Utilization—average CPU utilization
- Memory Utilization—average percent RAM used
- Storage Utilization—average percent storage used
After you make a selection, there is a brief delay while MC transmits information back to the requesting client. You can also click Sync in the toolbar to force synchronization between MC and the client.
Node Colors and What They Mean
Nodes in the database cluster appear in color. Green is the most healthy and red is the least healthy, with varying color values in between.
Each node has an attached information dialog box that summarizes its score. It is the score's position within a range of 0 (healthiest) to 100 (least healthy) that determines the node's color bias. Color bias means that, depending on the value of the health score, the final color could be slightly biased; for example, a node with score 0 will be more green than than a node with a score of 32, which is still within the green range but influenced by the next base color, which is yellow. Similarly, a node with a score of 80 appears as a dull shade of red, because it is influenced by orange.
MC computes scores for each node's color bias as follows:
- 0-33: green and shades of green
- 34-66: yellow and shades of yellow
- 67-100: red and shades of red shades
If the unhealthy node were to consume additional resources, its color would change from a dull orange-red to a brighter red.
Filtering Nodes From the View
The health filter is the slider in the lower left area of page. You can slide it left to right to show or hide nodes; for example, you might want to hide nodes with a score smaller that a certain value so the UI displays only the unhealthy nodes that require immediate attention. Wherever you land on the health filter, an informational message appears to the right of the filter, indicating how many nodes are hidden from view.
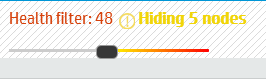
Filtering is useful if you have many nodes and want to see only the ones that need attention, so you can quickly resolve issues on them.