Monitoring Node Activity
If a node fails on an MC-managed cluster or you notice one node is using higher resources than other cluster nodes—which you might observe when monitoring the Overview page—open the Manage page and click the node you want to investigate.
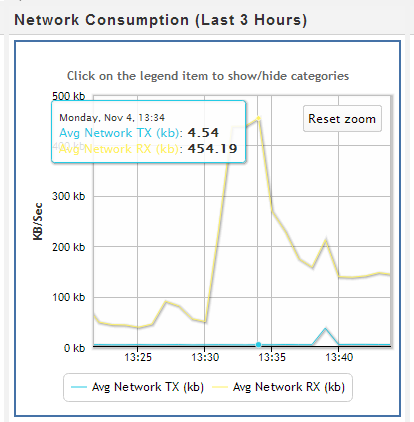
The Node Details page opens and provides summary information for the node (state, name, total memory, and so on), as well as resources the selected node has been consuming for the last three hours, such as average CPU, memory, disk I/O percent usage, network consumption in kilobytes, and the percentage of disk storage the running queries have been using. You can also browse and export log-level data from AgentTools and Vertica log files. MC retains a maximum of 2000 log records.

For a more detailed view of node activity, use the mouse to drag-select around a problem area in one of the graphs, such as the large spike in network traffic in the above image. Then hover over the high data point for a summary.