Extended Monitoring
Enabling extended monitoring allows you to monitor a longer range of data through MC. This can offer insight into long-term trends in your database's health. MC can also continue to display your monitored database's dashboard while it is down.
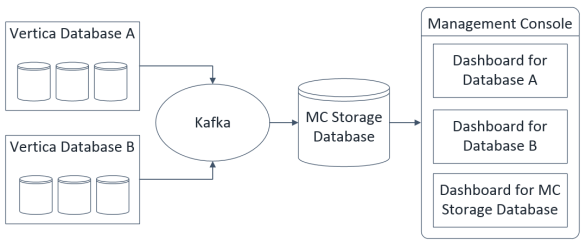
Extended monitoring uses Kafka to stream monitoring data from your monitored databases to a single MC storage database. MC can query the storage database instead of your monitored database to render some of its charts, reducing impact on your monitored database's performance.
How Extended Monitoring Works
By default, MC monitors your database by querying it directly for monitoring data about system activities, performance, and resource utilization. Typically, the Data Collector stores all monitoring data in data collector (DC) tables. However, DC tables have limited retention periods. See Retaining Monitoring Information.
Extended monitoring stores your database's monitoring data in a dedicated storage database. Vertica streams data from your database's DC tables through Kafka servers to the storage database. To use extended monitoring, you must have access to a running Kafka server. For more how Vertica integrates with Kafka, see Integrating with Apache Kafka .
After you set up and enable extended monitoring for a monitored database, MC renders several of your database's charts and graphs by querying the MC storage database instead of directly querying the database you are monitoring.
You can enable extended monitoring for any, or all, of your monitored databases. The MC storage database provides a single repository for monitoring data from every database that uses enabled extended monitoring.
In the following example, Kafka streams system data from two monitored databases to the storage database. MC uses the storage database to render individual dashboards for each monitored database. Be aware that MC always creates a dashboard that monitors the MC storage database.

Use Extended Monitoring
When a database has extended monitoring enabled, the MC charts that use the feature display a rocket ship icon in the corner. You can use these charts to access longer-term data about your database's health or performance.
To view historical information in these charts, click the calendar icon to specify the timeframe to display. For example, if your database has been down for several hours, your charts do not display recent activity in your database. You could use the timeframe filter in the System Bottlenecks chart to see unusual resource usage occurred in your database in the hour it went down.
You can view a history of the Kafka streaming jobs loading data into the storage database. MC displays these jobs on the Load tab of your storage database's dashboard. See Viewing Load History.
Set Up Extended Monitoring
To set up extended monitoring, see Managing the Storage Database and Managing Extended Monitoring on a Database.