Monitoring Resource Pools
Management Console allows database administrators to monitor and configure resource pools through the Activity and Configuration pages. These pages help you manage workloads by providing visual representations of resource usage as well as resource pool configuration options.
Monitoring Resource Pools Charts
You can monitor your resource pools using the Resource Pools Monitoring charts, accessible through the Management Console Activity page.
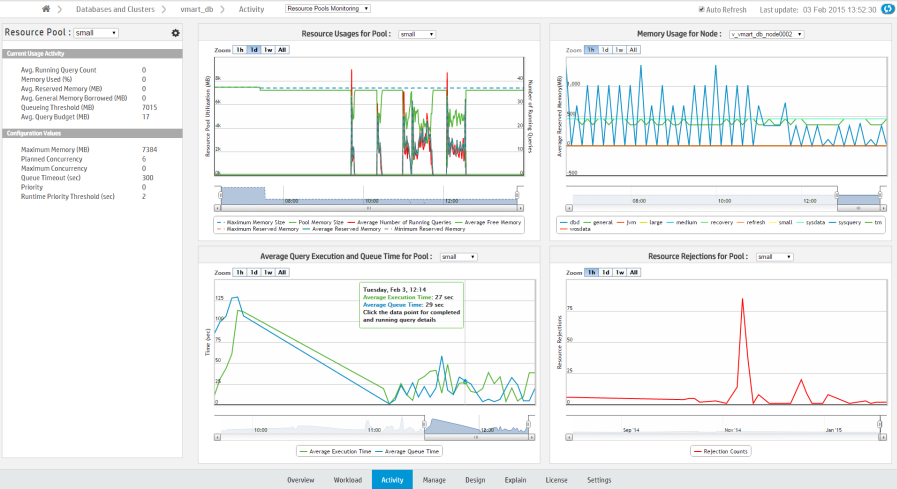
Select a resource pool to view using the Resource Pool menu, located in the leftmost sidebar. In the sidebar, Current Usage Activity displays the pool's real-time statistics.
Monitor the selected resource pool using the following charts, which display the pool's historic data:
- Resource Usages for Pool: Shows the historically averaged acquired memory usage by each pool across all nodes. The graph uses two y-axes, one that shows memory size, and a second that shows the total number of running queries. Data is collected every hour. Hover over a data point for a summary of the memory usage at that specific point.
- Memory Usage in Node: Shows the historically acquired memory usages by all pools across all nodes. Data is collected every hour. Hover over a data point for a summary of the memory usage at that specific point. Use the title bar dropdown to display the memory usage for a specific node. For Eon mode databases, you can also display the memory usage for a specific subcluster, all subclusters, or nodes not assigned to a subcluster. An Eon mode database has one default subcluster, and may have additional user-defined subclusters.
- Average Query Execution and Query Time in Pool: Shows the averaged query queue time plotted against the query execution time by each pool across all nodes. Data is collected every minute. Hover over data to get the average query execution and queue time in the specified pool. Click a data point to show detailed individual query information.
- Resource Rejections in Pool: Shows the historical total number of resource requests that were rejected in each pool across all nodes. Data is collected every hour. Click a data point to show rejection details and reasons in a pop-up window.
Configuring Resource Pools in MC
Database administrators can view information about resource pool parameters and make changes to existing parameters through the Management Console Configuration page. You can also create and remove new resource pools, assign resource pool users, and assign cascading pools.
See Configuring Resource Pools in Management Console
Permissions
Only the database administrator can monitor and configure resource pools in Management Console.