


Vertica Integration with iDashboards: Connection Guide
About Vertica Connection Guides
Vertica connection guides provide basic instructions for connecting a third‑party partner product to Vertica. Connection guides are based on our testing with specific versions of Vertica and the partner product.
Vertica and iDashboards: Latest Versions Tested
| Software | Version |
|---|---|
| Partner Product |
iDashboards 11.2d On-premises |
| Partner Product Platform | Windows Server 2019 Standard |
| Vertica Client |
Vertica JDBC 11.1.0-0 |
| Vertica Server | Vertica Analytic Database 11.1.0-0 |
| Vertica Server Platform | Red Hat Enterprise Linux 7.3 |
iDashboards Overview
iDashboards is a business intelligence platform that provides tools to connect and combine multiple data sources, create interactive dashboards, and share insights. iDashboards is a web-based application available for Windows and Linux. It uses JDBC and allows live connections to Vertica when writing a custom SQL query or selecting a single table/view.
Installing iDashboards
Follow these steps to install iDashboards. Check the system requirements in the iDashboards Administrator’s manual provided by the support team:
- Go to https://www.idashboards.com/.
- Click REQUEST DEMO on the right side of the screen.
- Fill the form and click REQUEST DEMO to request a trial of the software.
- Download the iDashboard software from the download link provided to you.
-
Double-click the installer and follow the prompts for installation.
Note The components installed are iDashboards server and DataHub. The product installation location is: c:\Program files\iDashboards_SRV
The iDashboards service automatically starts after installation.
Installing the Vertica Client Driver
iDashboards uses JDBC to connect to your Vertica database. To install or upgrade the Vertica JDBC driver, follow these steps:
- Navigate to the Client Drivers page on the Vertica website.
- Download the latest version of the JDBC driver.
Note For details about client and server compatibility, see Client Driver and Server Version Compatibility in the Vertica documentation.
- Paste the downloaded jar file into the folder for external libraries in the following iDashboards installation location:
C:\Program Files\iDashboards_SRV\ivizgroup\drivers
Connecting iDashboards to Vertica
Follow these steps to create a connection to Vertica:
- In a browser, open the iDashboard URL: http://<my_idashboards_server>:6700/idashboards/.
- In the login screen, enter user and password and click LOG IN.
- In the home page, click the ADMIN icon.
- In the Admin page, click the DATA SOURCES icon.
- In the Data Sources page, click New.
-
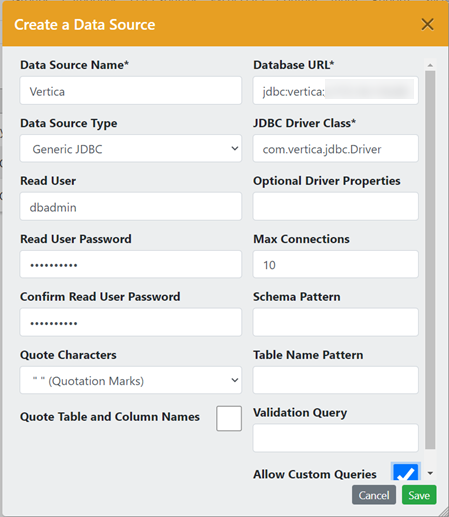
In the Create a Data Source pop-up window, enter the following parameters to connect to your Vertica database:
- Data Source name: A name for your connection to Vertica.
- Data Source Type: From the drop-down list, select Generic JDBC.
- Read User: Your database user.
- Read User Password: Your database user password.
- Confirm Read User Password: Re-enter your database user password.
- Quote Characters: This is the type of Quotation Marks used in the queries generated by iDashboards. The default value is recommended.
- Quote Table and Column names: When this option is checked, the queries generated will use quotation marks to enclose table/view names and columns. This option allows for the use of reserved words as table and column names.
- Database URL: This is the JDBC connection string in the format:
jdbc:vertica://<my_vertica_server>:5433/<my_vertica_db> - JDBC Driver Class: Vertica’s java driver class which is:
com.vertica.jdbc.Driver - Optional Driver Properties: In this box you can customize connection properties such as ConnectionLoadBalance, SSL, and Label. For example, Label=iDashLabel; ConnectionLoadBalance=1.
For a complete list of JDBC connection properties, see JDBC Connection Properties. -
Max connections: You can specify the maximum number of concurrent connections in the connection pool. By default iDasboards opens a maximum of 10 concurrent sessions.
-
Schema Pattern: This can be used to narrow down the list of schemas to explore.
-
Table Name Pattern: This can be used to narrow down the list of tables to explore.
-
Validation Query: This is a SQL statement that iDashboards runs to determine if a connection from the pool of connections is still active. If the query fails to run, the connection is discarded from the pool.
-
Allow Custom Queries: Vertica recommends selecting this option to be able to write custom SQL statements that are executed directly in your Vertica database. This is the recommended option to join multiple tables/views and leverage the speed of Vertica. When this option is checked the Vertica data source will be listed in Chart Designer > Custom Query.
- Click Save. The connection is tested and if it is successful, it is saved and listed in the Data Source table in the screen.
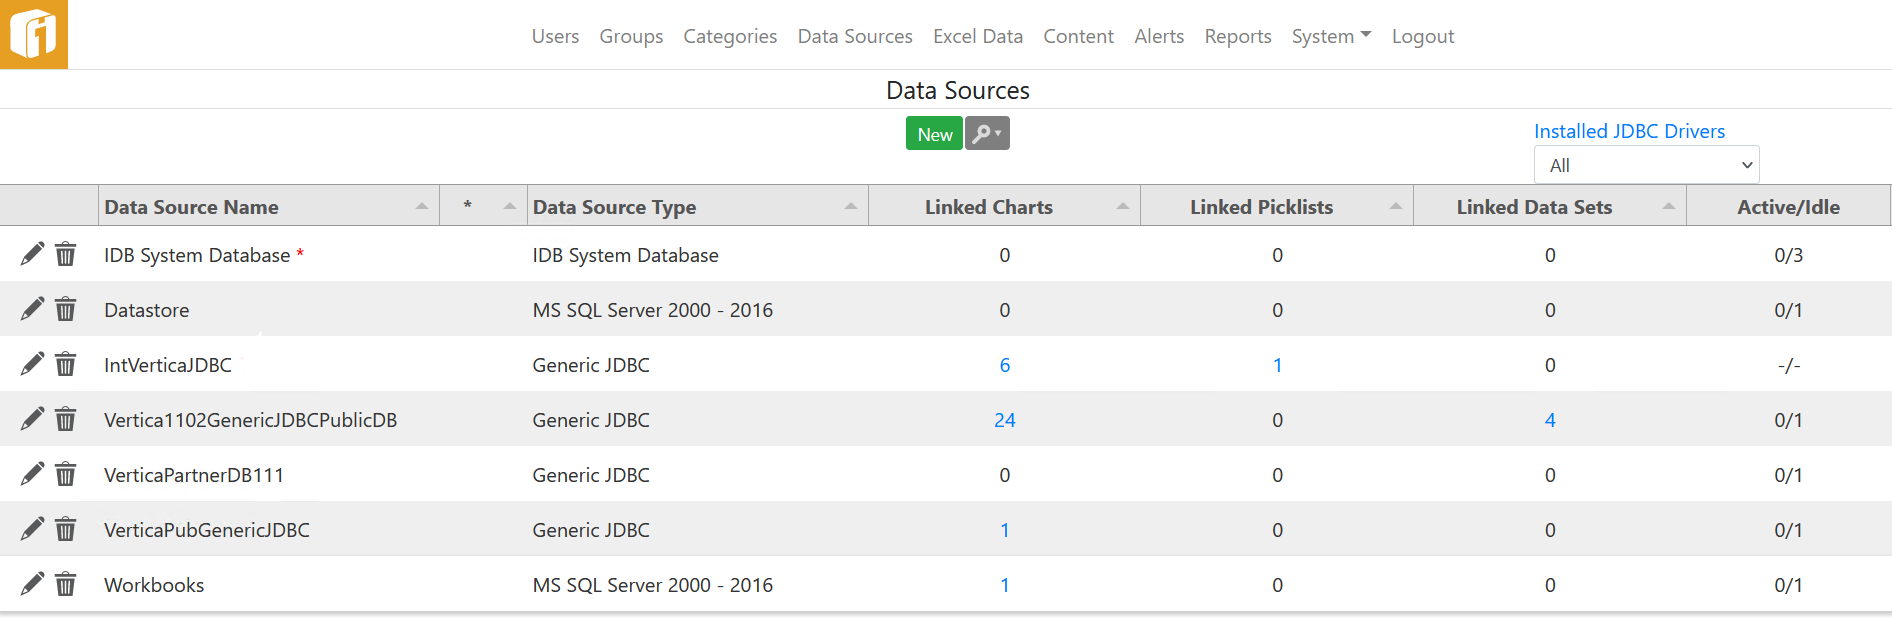
Now you should be able to use this data source to access data in Vertica and design your charts and dashboards.
Troubleshooting
Review these known issues and their workarounds when connecting to Vertica using iDashboards.
Error message: 404 Page Not Found! When attempting to open iDashboards URL for the first time.
Issue: The iDashboards tomcat service requires you to log on as Local System account. If log on is not setup as Local System account, the following error message is displayed the first time you attempt to access iDashboards through your browser:
404 Page Not Found!
The page you were looking for was not found. Please check the URL again and refresh your browser.
If that does not fix the issue please contact your system administrator.
Solution: In the machine where iDashboards is installed, go to Control Panel > Services:
1. Double-click the service iDashboards Server.
2. Click the Log On tab.
3. Select Log on as Local System account.
4. Click Apply, and then click OK.
After this update, refresh the browser and you should be able to see the iDashboards log in screen.
Known Limitations
The following is a list of known limitations with data types when connecting to Vertica from iDashboards via JDBC:
- BINARY, VARBINARY, LONG VARBINARY, INTERVAL, and UUID data types are not displayed in the user interface for both Table/View and Custom Query. As a work around use a custom query to display data for these data types.
- For NUMERIC data types, in both View Data and Chart/Tabular formats, values of up to 309 digits of precision is displayed. Larger values are not displayed and the error "An error occurred while communicating with the server: SyntaxError: Unexpected token I in JSON at position <position#> (200)" is displayed.
- For INTEGER data type, up to 16 digits is displayed in preview/view data. Larger values are displayed correctly in a chart or tabular format.
- For TIME data type, values are converted to datetime and milliseconds are not displayed.
- For TIMESTAMP data type, only the date part of the value is displayed in a Chart or a Tabular format. The complete value (date and time parts) is displayed in preview/show data, but milliseconds are not displayed.
- For TIMETZ data type, values are converted to datetime. Milliseconds and time zone offset are not displayed.
- For TIMESTAMPTZ data type, milliseconds and time zone offset are not displayed. Time part of the value is not displayed in a chart or tabular format and it is incorrect in Show Data/Preview. Smallest TIMESTAMPTZ value in Vertica (0001-01-01 00:00:00-05) is not displayed correctly.
For More Information
- iDashboards Website
- iDashboards Documentation
- iDashboards marketing/partnership page: iDashboards | Vertica
- Vertica Community Edition
- Vertica User Community
- Vertica Documentation

