
Vertica QuickStart for Tableau
To read this document in PDF form, click here.
The Vertica QuickStart for Tableau is a sample application implemented as a set of Tableau dashboards powered by the Vertica Analytic Database. The dashboards present sample retail data for analysis. The QuickStart shows how retail companies could use Vertica and Tableau to quickly explore, visualize, and gain insight into their data stored in Vertica.
You can download the Vertica QuickStart for Tableau from the following location:
https://www.vertica.com/quickstart/vertica-quickstart-for-tableau/
About the Vertica QuickStarts
The QuickStarts are posted for download on the Vertica QuickStart Examples page.
Note The Vertica QuickStarts are freely available for demonstration and educational purposes. They are not governed by any license or support agreements and are not suitable for deployment in production environments.
About Tableau
Tableau Software provides visualization and business intelligence products, including Tableau Desktop, Tableau Server, Tableau Online, and Tableau Mobile. For details, see the Tableau website.
Requirements
The Vertica QuickStart for Tableau requires a Vertica database server with the VMart example database, a Vertica client, and Tableau Desktop 9.0.
Installation and Setup
To install the software that is required for running the QuickStart, follow these steps:
- Install the Vertica Database Server
- Install the VMart Example Database
- Install Tableau Desktop
- Install the ODBC Client Driver
Install the Vertica Database Server
Vertica runs on Linux platforms. If you do not already have Vertica, you can download the Community Edition free of charge:
- Navigate to Vertica Community Edition.
- Log in or click Register Now to create an account
- Follow the on-screen instructions to download and install the Vertica Community Edition.
Install the VMart Example Database
The Vertica QuickStart for Tableau assumes a default installation of the Vertica VMart example database.
To install VMart, follow the instructions in the Vertica documentation:
For details, see VMart Example Database Schema, Tables, and Scripts.
Install Tableau Desktop
Tableau runs on Windows or Mac OS. If you do not have Tableau Desktop 9.0, you can download and install it as follows:
- Go to the Tableau website.
- Review the system requirements.
- Download the Tableau installation file that matches your operating system.
- Launch the executable.
- Follow the prompts to install Tableau.
Install the ODBC Client Driver
Tableau uses ODBC to connect to Vertica. The ODBC drivers for Vertica are part of a Vertica client package.
Install the ODBC Driver on Windows
- Go to https://vertica.com/download/vertica/client-drivers/.
- Download the Vertica client package that matches your operating system (32- or 64-bit) and your version of the Vertica database.
- As Windows Administrator, launch the installer and follow the prompts to install ODBC.
Install the ODBC Driver on Mac OS
- Go to https://vertica.com/download/vertica/client-drivers/.
- Download the Vertica client package for Mac OS.
- Launch the installer and follow the prompts to install ODBC.
Download the QuickStart
- Navigate to vertica.com/quickstart
- Select Vertica QuickStart for Tableau.
- Log in or create an account.
- Click Download.
Open the QuickStart and Provide Your Connection Information
To open the QuickStart and connect to Vertica:
- Either double-click the workbook file,
VMart_Quick_Start.twbx, or start Tableau and open the workbook from the File menu. - In the Sign In dialog box, click Edit Connection.
- In the Server Connection dialog box, enter the name or IP address of the server, the name of the database, and your user name and password.
- Click OK to connect to the Vertica example database.
Note The QuickStart uses several data sources within the VMart data warehouse. When you connect to a data source for the first time in the session, Tableau prompts you to re-enter your connection information.
About the QuickStart Dashboards
The QuickStart dashboards present sample business and operational data that a large retail chain might track over time. The chain operates brick-and-mortar stores and an online marketplace. It sells a wide variety of products that it purchases from different vendors.
Note The data in your dashboards will not match the data in the screen shots in this document. This is because the VMart data generator generates data randomly.
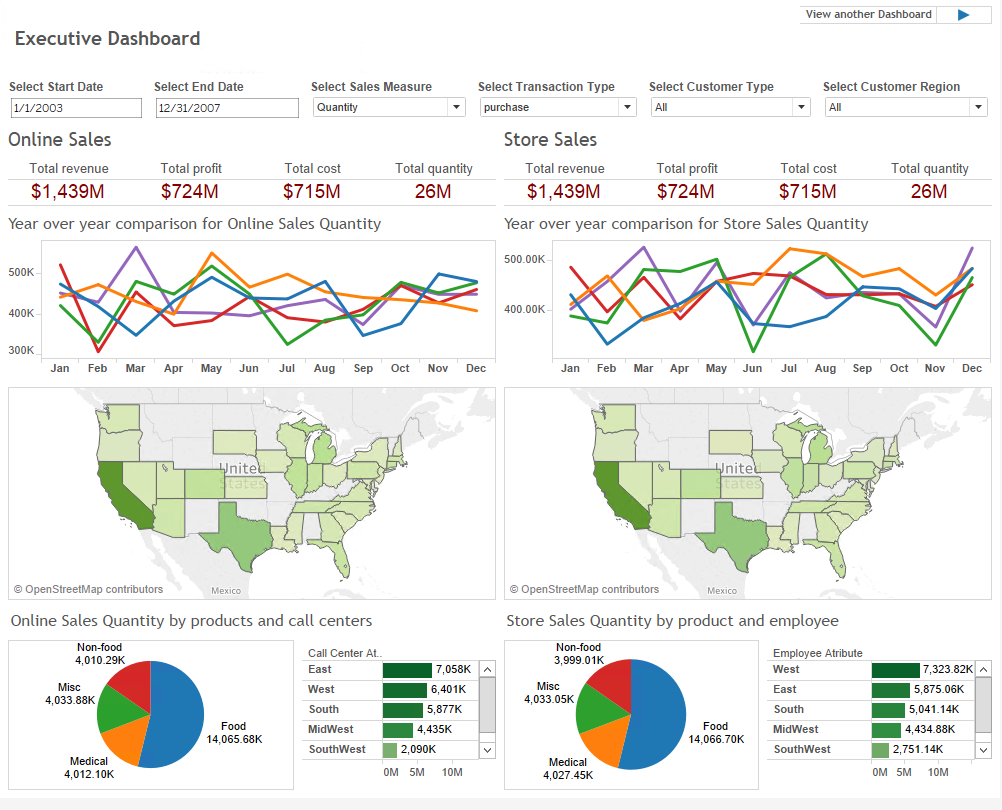
Executive Dashboard
The Executive Dashboard presents a high-level view of the business data that is shown in greater detail in the other dashboards. In this instance, the dashboard is displaying revenue figures for products purchased during the years 2005 and 2006. During this time period, the overall revenue from online and store sales was roughly equivalent, however the sales were distributed very differently over time, especially in 2005. During that year, online revenue dipped almost to zero in the third quarter while store sales were at their highest for the year.
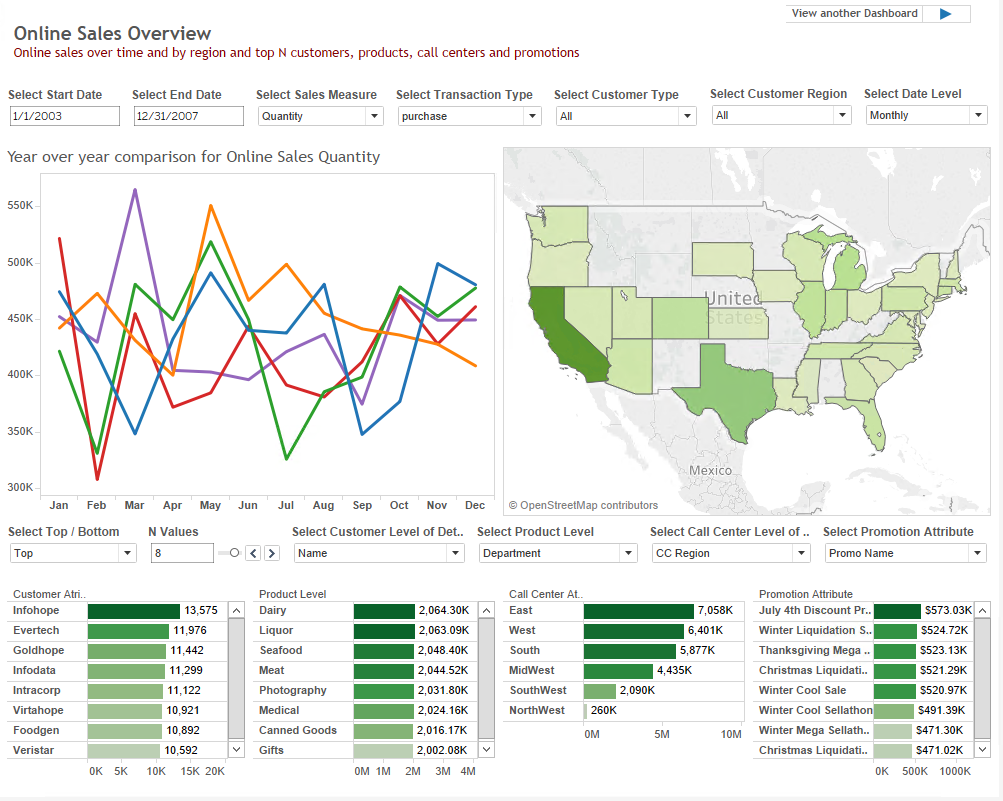
Online Sales Overview
This dashboard presents an overview of the online business. In this instance, the dashboard is displaying quarterly revenue for products purchased online during the years 2005 and 2006. In 2005, revenue peaked in Q2 and was at its lowest in Q3. In 2006, revenue was more even throughout the year.
To gain further insight into online sales, change the filters in the top row. For example, if you change Transaction Type from purchase to returns, you will see the negative revenue that must be taken into account for this time period.
Store Sales Overview
This dashboard presents an overview of the traditional business conducted in the brick-and-mortar stores owned by this retail chain. In this instance, the dashboard is displaying quarterly revenue for products purchased during the years 2005 and 2006. In 2005, revenue peaked in Q3. In 2006, revenue was more even throughout the year.
To gain deeper insight into store sales, change the filters in the top row. For example, if you change Date Level from Quarterly to Monthly, you will see a finer-grained analysis of the top customers, products, employees, and display types.

Customer Overview
This dashboard presents an overview of the online and store customers of the retail chain. In this instance, the dashboard is displaying quarterly revenue for the years 2005 and 2006 and includes the ages of the six customers who accounted for the greatest share of the revenue.
To gain a better understanding of your top customers during this period, explore the different attributes under Select Customer Level of Detail. For example, if you change the customer attribute from Age to Gender, you will learn the breakdown by both age and gender of this group of customers. Knowing who your top customers are is key in designing promotions and in minimizing churn.

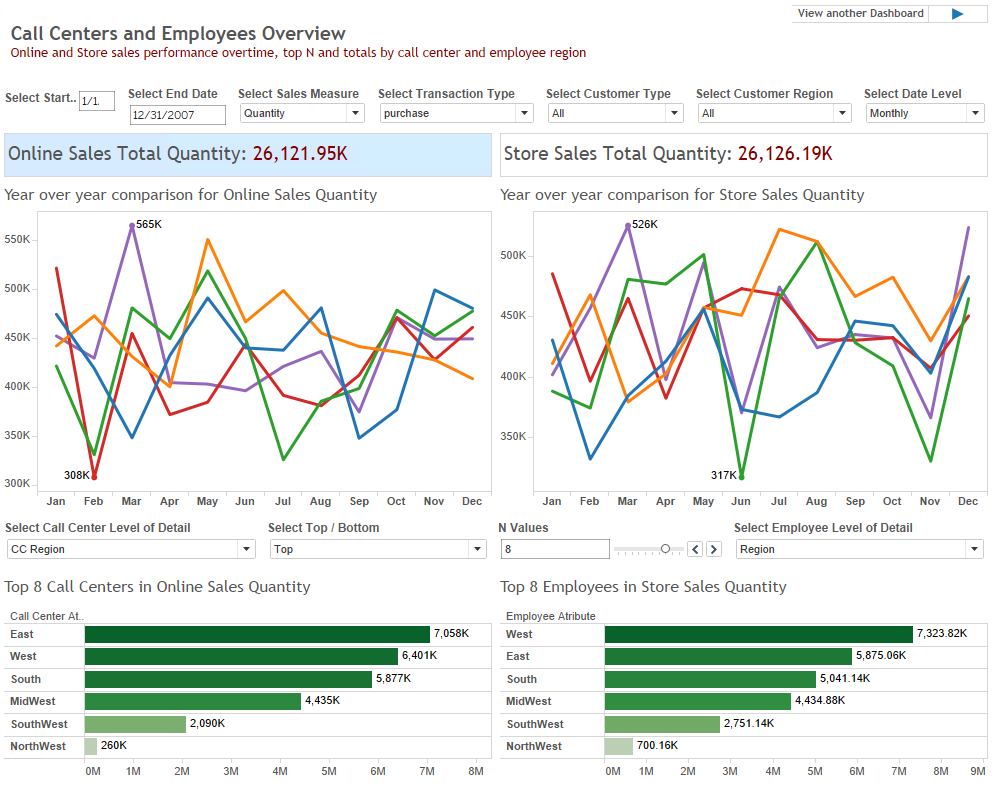
Call Center and Employee Overview
This dashboard presents an overview of the performance of the chain’s sales personnel, both in stores and in online call centers. In this instance, the dashboard is displaying quarterly revenue for products purchased during the years 2005 and 2006.
To gain a better understanding of your top performing call centers during this period, explore the different attributes under Select Call Center Level of Detail. For example, if you change the call center attribute from CC Region to CC Name, you will discover the specific call centers that are producing the most revenue. Knowing who your top performers are is key in designing incentive programs, allocating raises and bonuses, and in targeting areas for improvement.
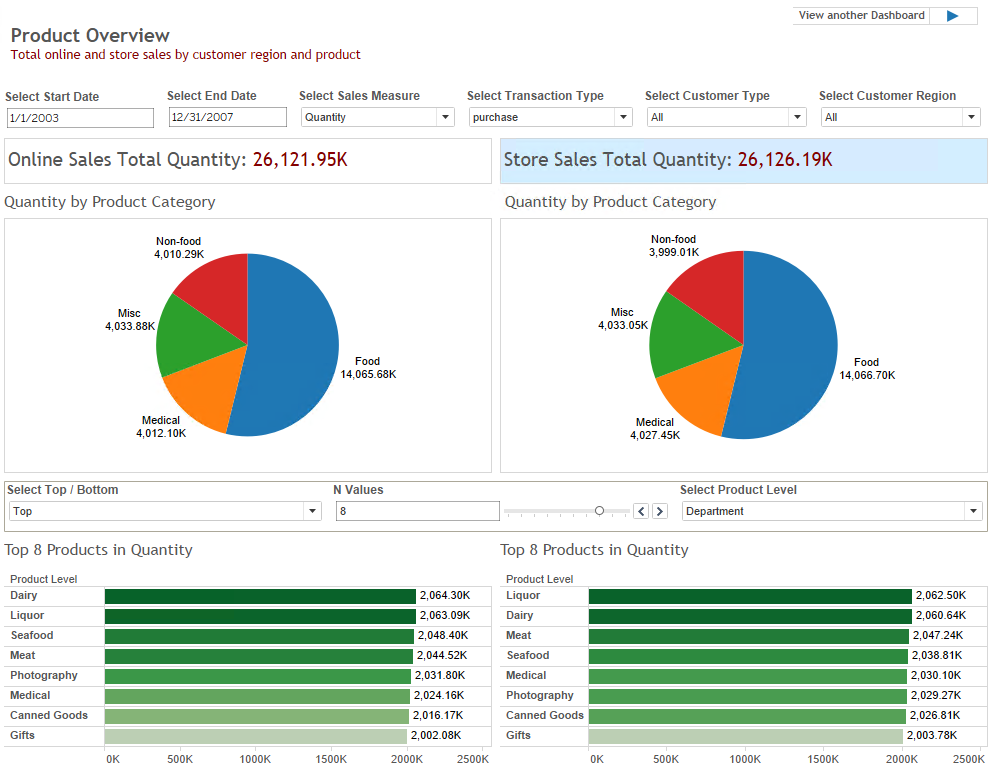
Product Overview
This dashboard presents an overview of the products and product categories sold in stores and online. In this instance, the dashboard is displaying revenue for products purchased during the years 2005 and 2006.
To gain a better understanding of your most popular products during this period, explore the different attributes under Select Product Level. For example, if you change the product attribute from Department to Product, you will learn the specific brands that are producing the most revenue.
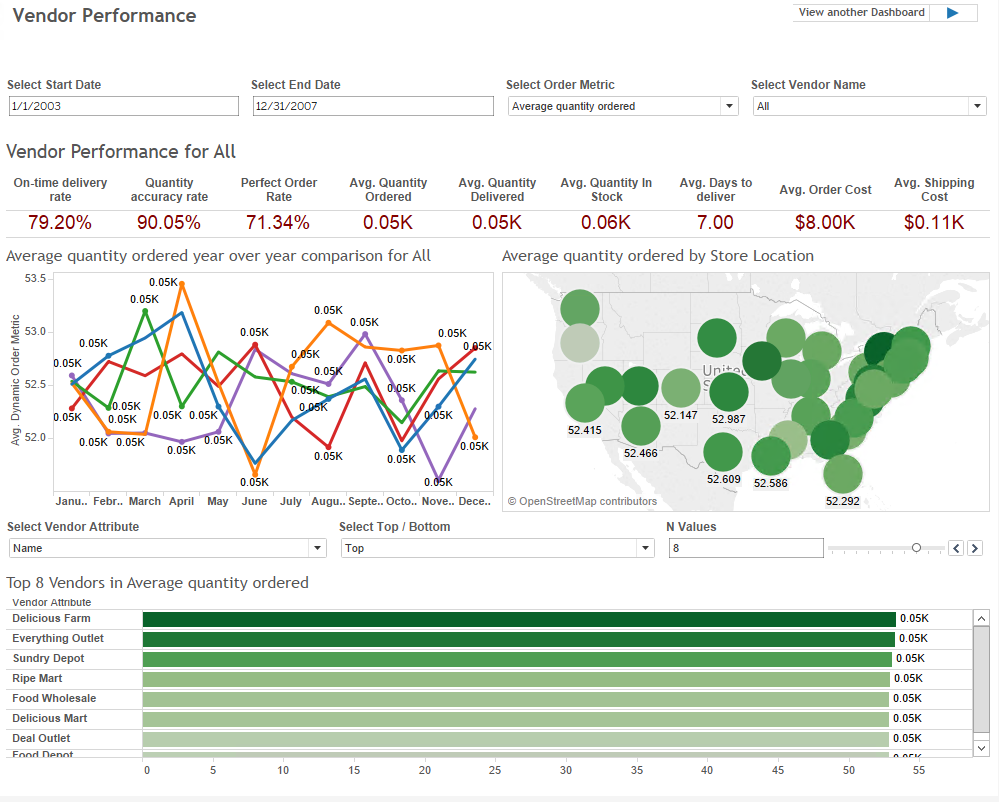
Vendor Performance
This dashboard presents an overview of the performance of the vendors used by this retail chain. In this instance, the dashboard is displaying Average days to deliver during 2005 and 2006 for the vendor Market Wholesale. Included in the display is the overall average for different store locations and the vendors with the best delivery times during this two-year period.
To learn more about the performance of Market Wholesale, choose a different metric, such as Average quantity ordered or Average quantity in stock. Select a different vendor under Select Vendor Name to learn about the performance of a different vendor.
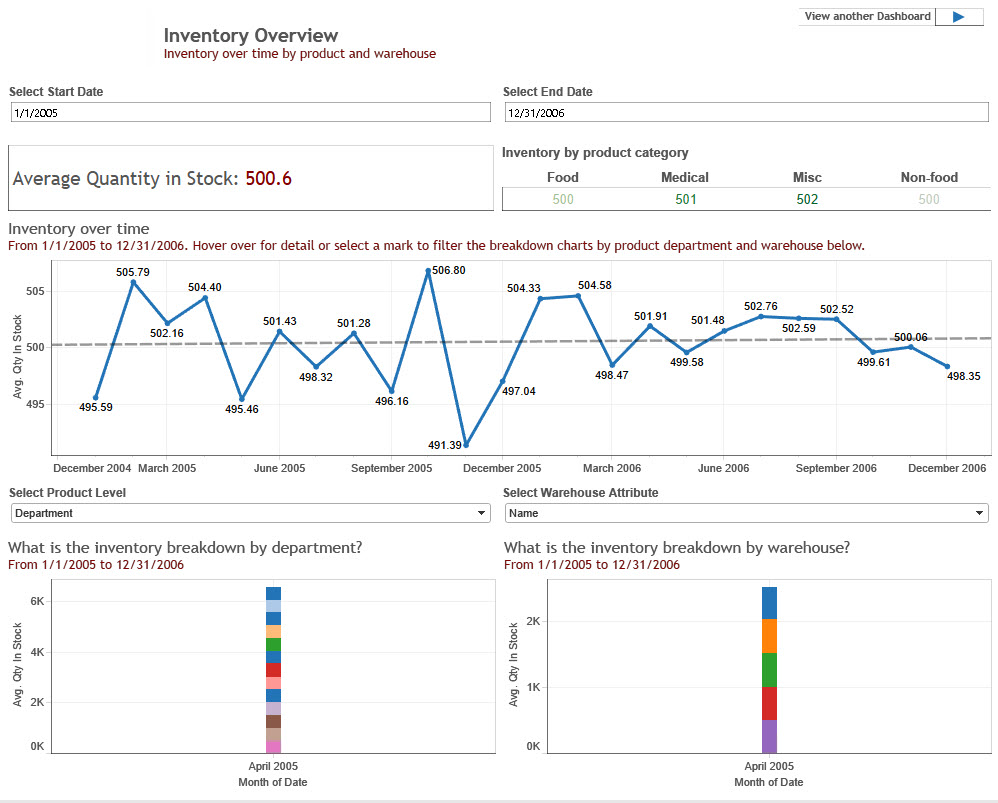
Inventory Overview
This dashboard presents an overview of the inventory held by this retail chain. In this instance, the dashboard is displaying inventory information for Medical and Misc products during 2005 and 2006.
To see inventory for food items, click Food under Inventory by product category. You can narrow your focus by selecting Product instead of Department under Select Product Level. Under Select Warehouse Attribute, you can focus in on inventory by location: for a specific warehouse, or by region, state, or city.