Vertica QuickStart for TIBCO Spotfire
To read this document in PDF form, click here.
The Vertica QuickStart for TIBCO Spotfire is a sample BI application implemented as a set of Spotfire dashboards powered by the Vertica Analytic Database. The dashboards present sample retail data for analysis. The QuickStart shows how retail companies could use Vertica and Spotfire to quickly explore, visualize, and gain insight into their data stored in Vertica. The QuickStart sample application is available as a .zip file that contains the DXP file for Spotfire.
You can download the Vertica QuickStart for TIBCO Spotfire from the following location:
https://www.vertica.com/quickstart/vertica-quickstart-for-tibco-spotfire/
About the Vertica QuickStarts
The QuickStarts are posted for download on the Vertica QuickStart Examples page.
Note The Vertica QuickStarts are freely available for demonstration and educational purposes. They are not governed by any license or support agreements and are not suitable for deployment in production environments.
About TIBCO Spotfire
TIBCO Spotfire is an enterprise-class analytics platform that includes built-in data wrangling and provides data discovery and predictive and geographical analytic. For information about TIBCO Spotfire, see the product site.
Requirements
The Vertica QuickStart for TIBCO Spotfire requires a Vertica database server with a standard installation of the VMart example database, a Vertica client driver, and TIBCO Spotfire Desktop 7.5.
The deployment of this QuickStart was tested on TIBCO Spotfire Desktop 7.5 using Vertica 7.2.x with ADO.NET 7.2.x.
Installation and Setup
To install the software that is required for running the QuickStart, follow these steps:
- Install the Vertica Database Server
- Install the VMart Example Database
- Install Spotfire
- Install the Vertica Client Driver
Install the Vertica Database Server
If you do not already have Vertica, you can download the Community Edition free of charge:
- Navigate to Vertica Community Edition.
- Log in or click Register Now to create an account
- Follow the on-screen instructions to download and install the Vertica Community Edition.
Install the VMart Example Database
The Vertica QuickStart for TIBCO Spotfire assumes a default installation of the Vertica VMart example database.
To install VMart, follow the instructions in the Vertica documentation:
For details, see VMart Example Database Schema, Tables, and Scripts.
Install Spotfire
If you do not already have TIBCO Spotfire, you can install it by following these steps:
- Sign up for a free 30-day trial from the Spotfire Cloud Website or from the Spotfire Desktop Website.
- After you log in, click your Name in the top right corner and navigate to the Downloads section to download Spotfire Analyst.
- Follow the installation instructions.
Install the Vertica Client Driver
TIBCO Spotfire uses ADO.NET to connect to Vertica. Before you can connect to Vertica using Spotfire, you must download and install the Vertica client package. This client package includes the ADO.NET driver that Spotfire uses to connect to Vertica.
To download and install the Vertica client package:
- Go to the Vertica Client Drivers page on the Vertica website.
- Download the Vertica client package that matches your operating system and the version of Vertica that you are using.
- Follow the steps for installing the Vertica client as described in the Vertica documentation.
Note Vertica drivers are forward compatible, so you can connect to the Vertica server using previous versions of the client. For more information, see Client Driver and Server Version Compatibility in the Vertica documentation.
Download the QuickStart
- Navigate to vertica.com/quickstart
- Select Vertica QuickStart for TIBCO Spotfire.
- Log in or create an account.
- Click Download.
Deploy the QuickStart for TIBCO Spotfire Dashboards
The DXP file is the file extension for an analysis file. TIBCO Spotfire can open a DXP file directly from the download location. However, we recommend that you save the DXP file (VerticaQuickStartforTIBCOSpotfire.dxp) in the Spotfire project location, such as:
C:\Users\<user>\Documents\Spotfire
Modify the Data Source Connection to the VMart Database
To connect to your specific Vertica VMart example database, follow these steps:
- Open TIBCO Spotfire Desktop by double-clicking the DXP file or by starting TIBCO Spotfire and opening the DXP file from the File menu.
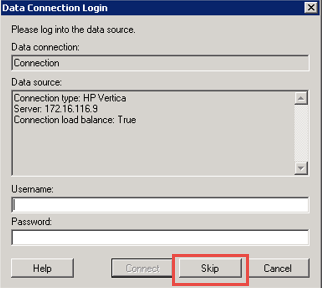
- The Data Connection Login window opens. Click Skip three times to open the QuickStart dashboard.
- From the Edit menu, select Data Connection Properties. The Data Connection Properties window opens.
- Click Settings.
- In the Data Connection Settings window, select the Data Source.
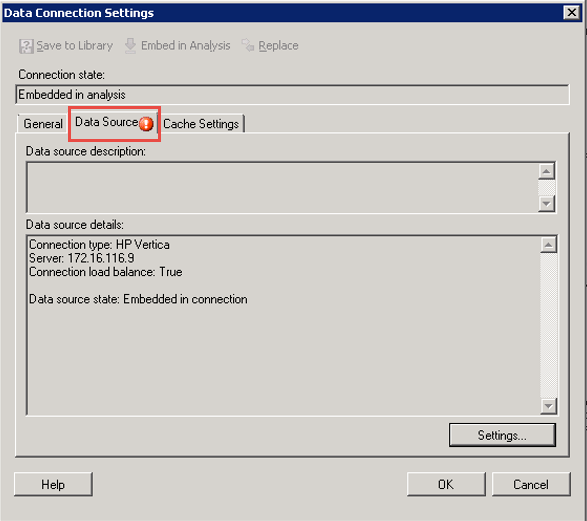
- Click Settings. The Data Source Settings window opens.
- Click Edit. Enter your Vertica Connection information, as shown in the following graphic:
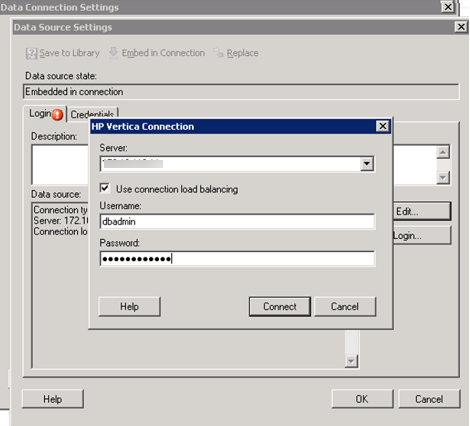
- If your database has Native Connection Load Balancing configured, check the Use connection load balancing box. If it is not enabled or if you are unsure, make sure the box is not checked. To verify that your Vertica cluster is set for load balancing, see this video.
- Click Connect.
- In the Data Source Settings window, click OK.
- In the Data Connection Settings window, click OK.
- In the Data Connection Properties window, you should see data being fetched in the dashboard. Click OK.
The Executive Dashboard appears.
QuickStart Example Dashboards
The QuickStart dashboards present sample business and operational data from the VMart example database that a large retail chain might track over time. The chain operates brick-and-mortar stores and an online marketplace. It sells a wide variety of products that it purchases from different vendors. This section shows some of the example dashboards.
Note The data in your dashboards will not match the data in the screenshots in this document. This is because the VMart data generator generates data randomly.
Executive Dashboard
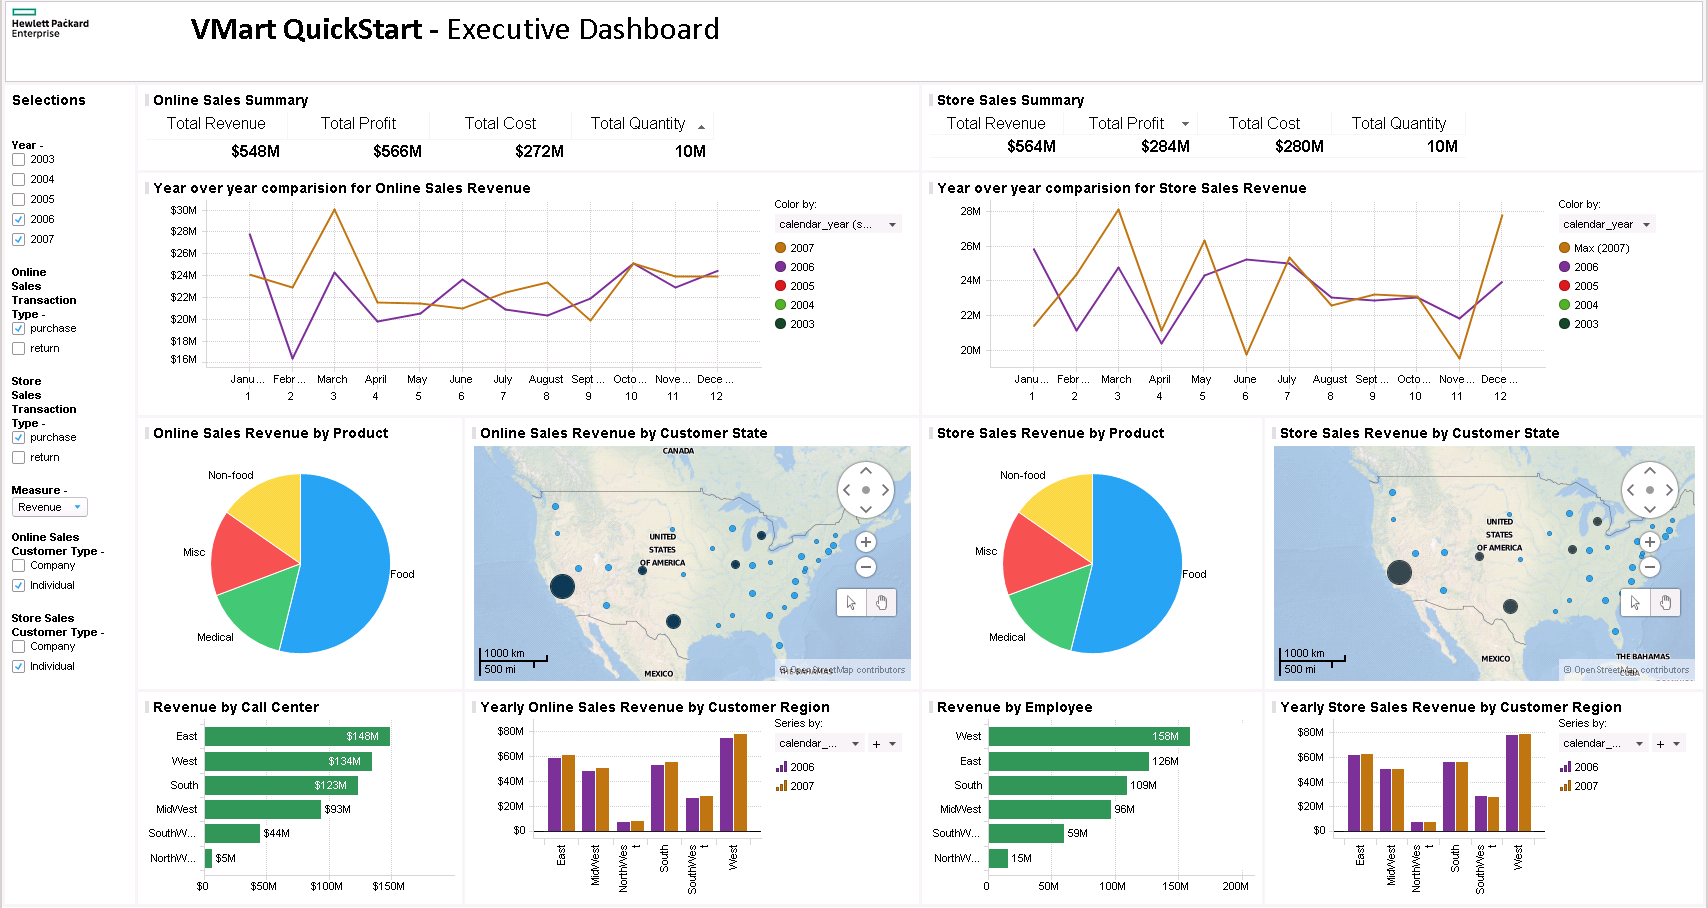
The Executive Dashboard presents a high-level view of business data. You can use this dashboard to analyze the overall functioning of the business over time.
In this instance, you can see a summary of sales purchases in 2006 and 2007. You can filter selections using the filter on the left of the dashboard.
Online Sales Dashboard
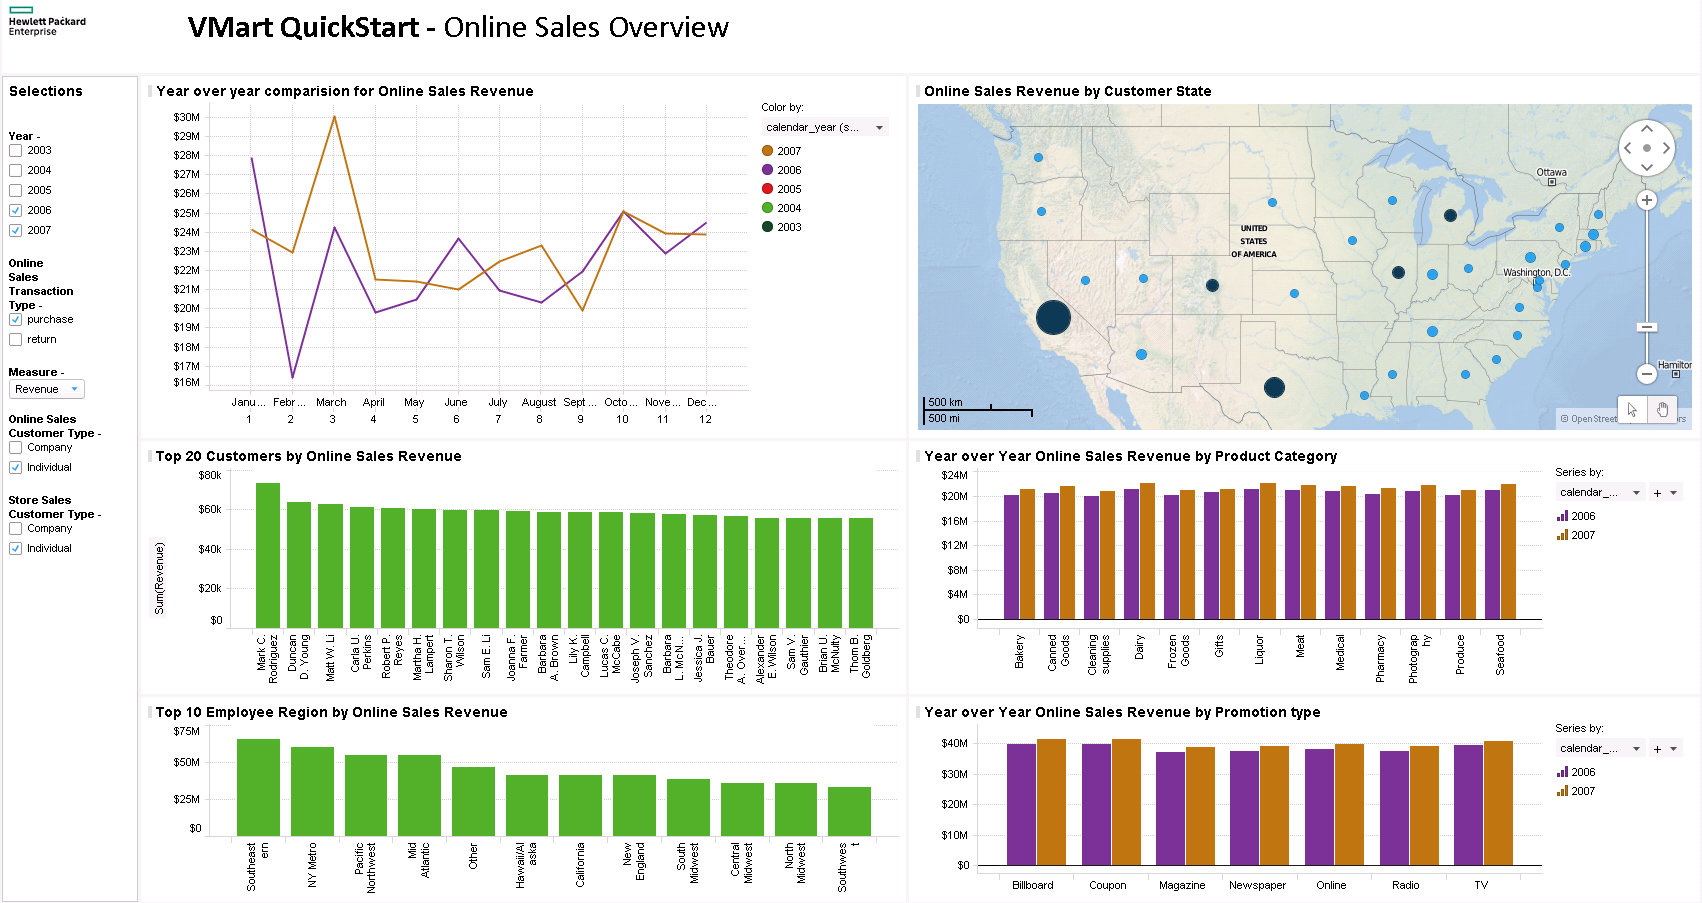
The Online Sales Dashboard presents an overview of the online business. You can use this dashboard to analyze the performance of the chain’s online sales over time.
In this dashboard, you can see that 2007 had higher sales over time than 2006 throughout the year. You can also see that online sales are clustered in the United States, from the world map view.
Store Sales Dashboard
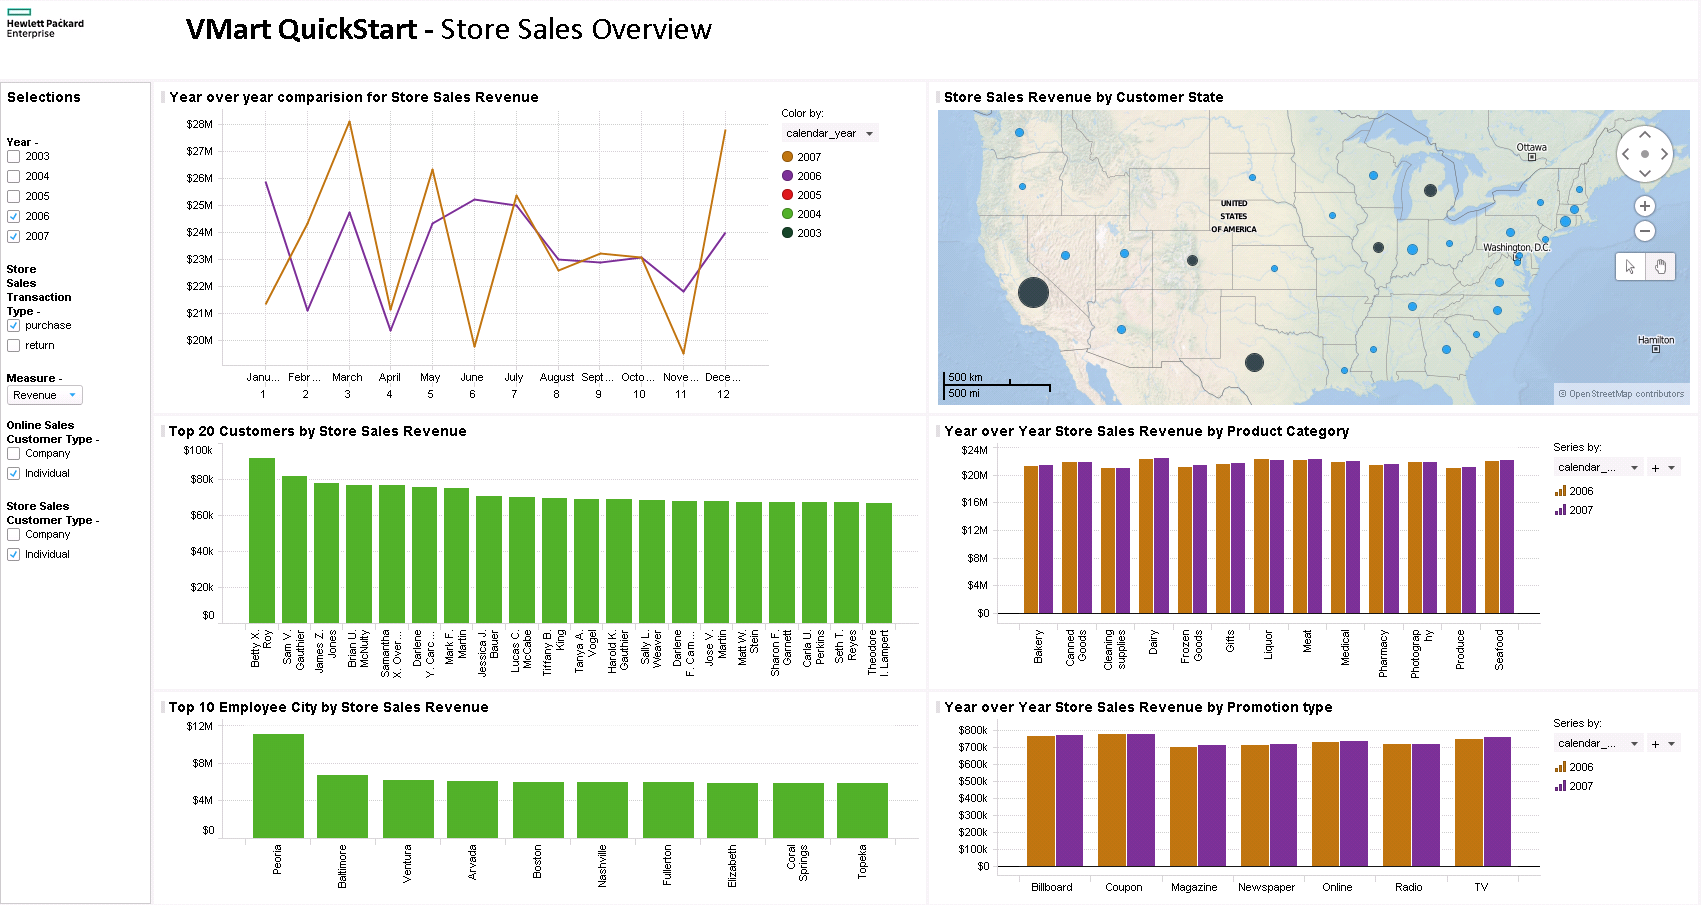
The Store Sales Dashboard presents an overview of the traditional business conducted in the brick-and-mortar stores owned by this retail chain.
In this dashboard, you can see that store sales in the United States are clustered on the east coast, with large revenue also coming in from California and Texas. You can also see that 2007 showed drastic differences in store sales, depending on the month. March and December were high revenue months, while June and November showed significant drops in revenue.
Customer Overview Dashboard
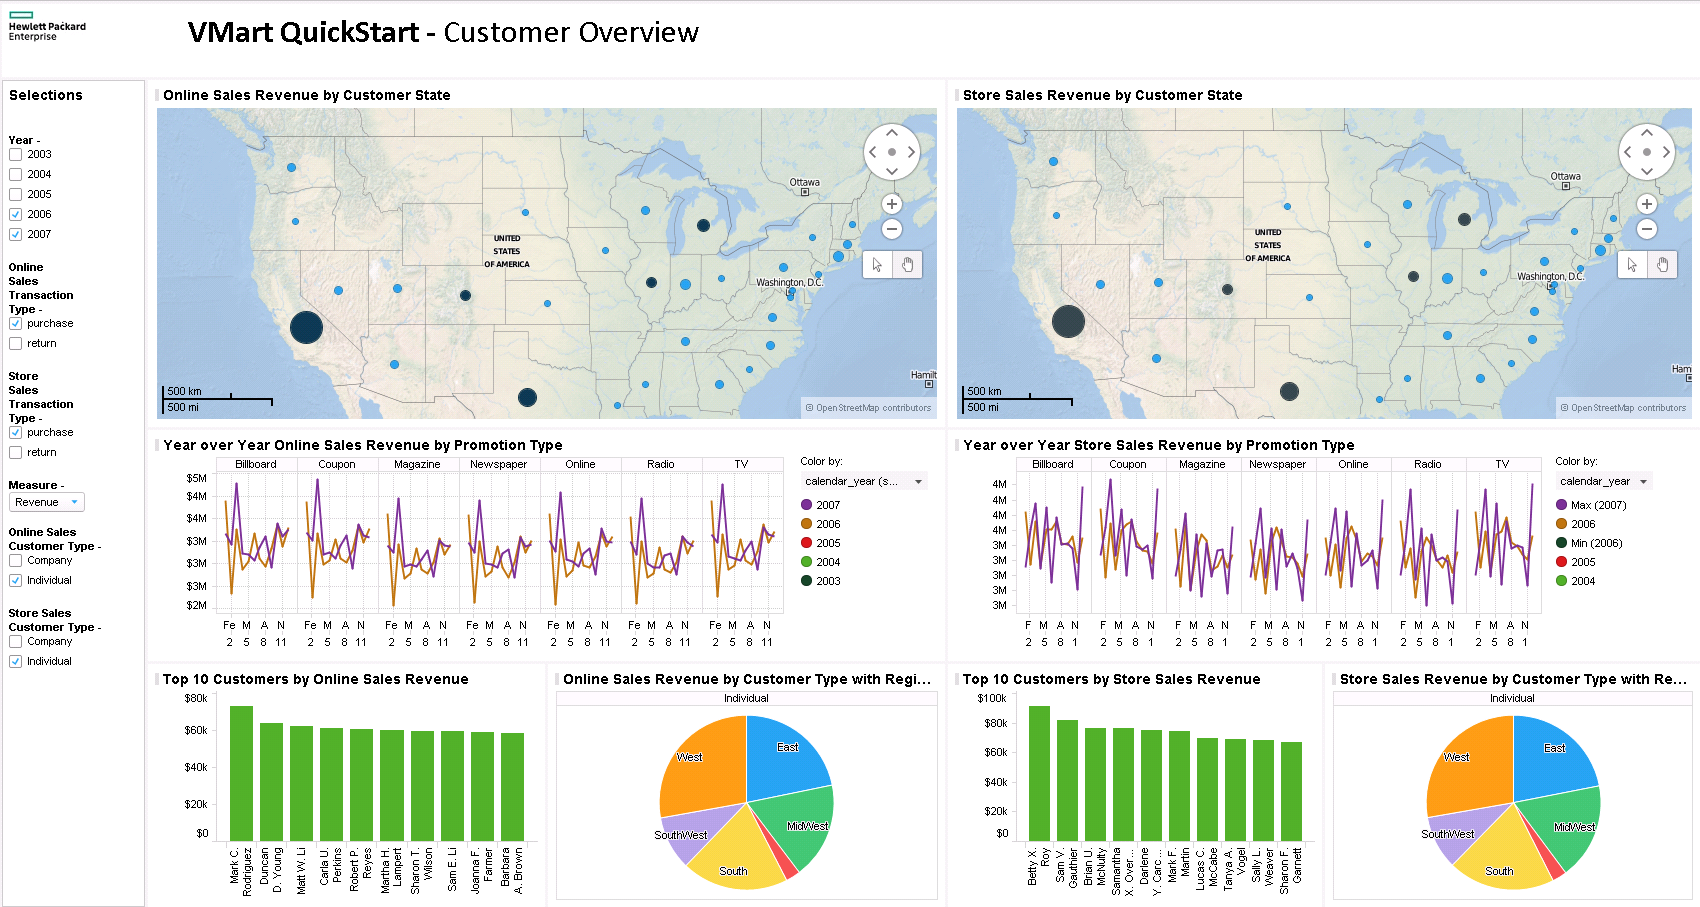
The Customer Overview Dashboard presents a look at customer data. In this dashboard, you can look at information about customers in specific regions, as well as look at the types of promotions that encourage customers to buy from this retail chain.
Call Center/Employee Overview Dashboard
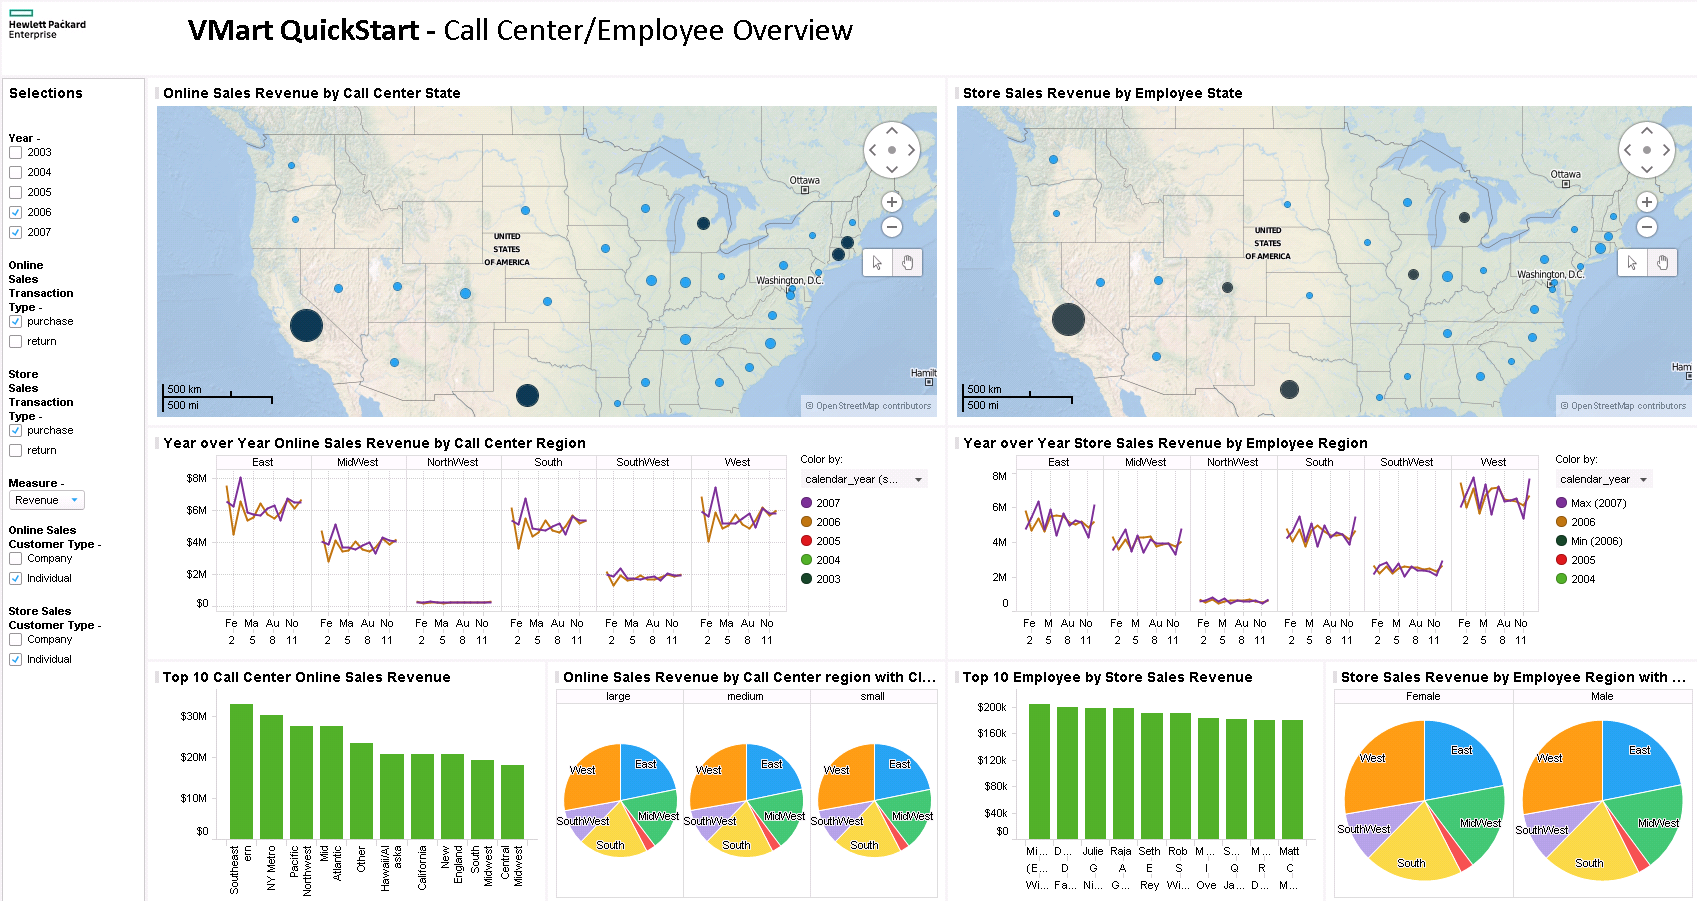
The Call Center/Employee Overview Dashboard presents a look at both employee regional data as well as information about the different call centers.
In this dashboard, you can look at information about the top call centers in both online and store sales. You can also view information about which regions perform better in online and store sales.
