


Vertica Integration with Tableau: Tips and Techniques
About Vertica Tips and Techniques
This document describes tips and techniques that can enhance your experience using Tableau Desktop and Tableau Server with Vertica. This document is based on our testing of Tableau with Vertica as described in Vertica and Tableau: Latest Versions Tested.
Tableau Overview
Tableau is a powerful and flexible business analytics tool that helps you quickly analyze, visualize, and share information.
Tableau Desktop
Tableau Desktop allows you to connect to data and create visualizations and interactive dashboards with an easy-to-use, drag-and-drop interface. Tableau Desktop is available for Windows and MacOS and uses ODBC to connect to Vertica.
Tableau Server
Tableau Server is a web-based application that allows you to publish and share the workbooks that you create using Tableau Desktop. Tableau Server is available for Windows and Linux, and uses ODBC to connect to Vertica.
There are two deployment options for Tableau Server:
- Tableau Server is hosted by users on premises.
- Tableau Cloud is Tableau Server hosted in the cloud and managed by Tableau.
For more information about tuning Tableau, see Tuning Tableau and Your Database for Great Performance.
Vertica and Tableau: Latest Versions Tested
This document is based on the results of testing the following versions of Tableau and Vertica:
| Software | Version |
|---|---|
| Tableau |
|
| Vertica Client |
Vertica ODBC Driver 12.0.0 |
| Vertica Server |
Vertica Analytic Database 12.0.0 |
Connecting Vertica and Tableau
To connect Vertica and Tableau, see Vertica Integration with Tableau: Connection Guide for more information and step-by-step instructions.
Tips for Connecting Tableau to Vertica
The following sections describe how to configure your Tableau-to-Vertica connection for optimal performance:
- Parallel Query Processing
- Live Connections Compared to Extracts
- Build your Tableau Data Source by Dragging Tables instead of Writing Custom SQL
- Join Culling in Tableau
- Checking for Well-Constructed Joins
- Cross-Database Joins
For more details about connecting Tableau to Vertica, see:
- Vertica Integration with Tableau: Connection Guide in the Vertica Knowledge Base.
- Instructions for connecting to Vertica in the Tableau documentation.
Parallel Query Processing
Tableau opens multiple connections to a Vertica database, allowing queries to execute in parallel in multiple concurrent threads.
Tableau automatically creates a new connection for each independent query until the limit for parallel connections is reached. By default, the limit is 16 connections. If a query depends on the results of a previous query, Tableau sends it to Vertica sequentially.
Caution
Use caution when taking advantage of the parallel query processing capability. Depending on the number of concurrent users, resource pool configuration settings, and dashboard content, you may want to decrease the connection limit to avoid potential resource contention issues.
You can use the following tools to identify the queries that are sent in parallel to your Vertica database:
- Tableau Performance Recorder, as described in Record and Analyze Workbook Performance.
- Vertica system table, as described in QUERY_REQUESTS.
For information about modifying the Tableau connection limit, see:
- Set the Maximum Number of Connections for a Single Data Source
- Set the Maximum Number of Connections for All Connections
Connection Pools
Tableau creates a separate connection pool for each data source in the workbook that generates a unique connection string. The default maximum number of connections in a connection pool is 16, but you can modify this maximum.
For example, in your Tableau workbook, you can have three data sources that connect to the same Vertica server and database with the exact same connecting string. That would result in a single connection pool shared by all three data sources in the workbook. On the other hand, if you have three data sources pointing to the same Vertica server and database but with different connection strings (for example each one using a different user ID/password), then each of them will use a separate connection pool. You can modify the maximum number of connections for each connection pool independently.
Set the Maximum Number of Connections for a Single Data Source
You can control the maximum number of connections from Tableau to Vertica with connection properties such as class, server, and database.
To set limits for data sources, or for Vertica on specific servers, create a configuration file with the desired settings. Tableau parses the contents of the configuration file from top to bottom and chooses the first match for a specific connection:
- Create an XML file named
connection-configs.xml. -
Save the file as follows:
-
For Tableau Server, save the file in the
config\vizqlserverfolder. The following is an example on Windows:C:\ProgramData\Tableau\TableauServer\data\tabsvc\config\vizqlserver
Note Remember to copy the configuration file to all the vizqlserver folders on all Tableau machines.
-
For Tableau Desktop, save the file in the Tableau Desktop folder. The following is an example on Windows:
C:\Program Files\Tableau\Tableau <version-number>
Note
Make sure that the path corresponds to the version of Tableau that you are using.
-
-
Copy and paste the following content into the file. Modify the values for server, database, and number of connections to reflect your setup.
<?xml version='1.0' encoding='utf-8' ?>
  <connection-list>
     <connection class='vertica' server='15.126.227.222'
	 dbname='verticanow'>
	<limit max='4'>
	</limit>
     </connection>
     <connection class='vertica' server='172.16.116.45'>
	<limit max='10'>
	</limit>
     </connection>
     <connection class='vertica'>
	<limit max='12'>
	</limit>
     </connection>
</connection-list>
Note In the example file above:
-
The first connection class sets a limit of 4 connections for any workbook that uses server name 15.126.227.222 and database name verticanow.
-
The second connection class sets a limit of 10 connections for any workbook that has a server name of 172.16.116.45.
-
The third connection class sets a limit of 12 connections for all other connections to Vertica.
Set the Maximum Number of Connections for All Connections
In Tableau Desktop, to set a connection limit for all connections during a particular session, use the -DConnectionLimit command-line switch.
For example, to launch Tableau Desktop with a connection limit of 2 for all connections, type the following at the Windows command prompt:
"C:\Program Files\Tableau\Tableau <version-number>\bin\tableau.exe" -DConnectionLimit=2
Note Make sure that the path matches the version of Tableau that you are using.
In Tableau Server, you can disable parallel query execution for all connections by using tabadmin and setting the maximum number of connections to 1:
tabadmin set native_api.connection.limit.globallimit 1
To set the connection limit to, for example, 20:
tabadmin set native_api.connection.limit.globallimit 20
Vertica MaxClientSessions Parameter
In Vertica, the maximum number of concurrent connections per cluster is limited by physical RAM of a single node (or number of threads per process). The default limit per node is 50. You can modify the maximum number of connections with the MaxClientSessions parameter.
Before changing the MaxClientSessions setting, refer to the following topics in the Vertica documentation:
Live Connections Compared to Extracts
After you connect to Vertica, you can maintain a live connection, or you can create a data extract. A data extract is data from Vertica that you store locally in Tableau.
We recommend that you use a live connection when:
- You need to leverage the analytic capabilities of Vertica.
- The volume of data is not conducive to creating an extract.
- Your workbook uses pass-through RAWSQL functions.
- You need near real-time analysis.
- You need robust user-level security.
Use data extracts only when:
- You need offline access to the data.
- Many users are accessing a single workbook with data that is not needed in real time.
Build your Tableau Data Source by Dragging Tables instead of Writing Custom SQL
We recommend that you create a data source by dragging multiple tables from the same database to the Drag tables here area/canvas, instead of using the New Custom SQL option in the Data Sources window. This recommendation applies when you construct inner and outer join queries.
When you build your joins by dragging and dropping tables in the UI, Tableau takes advantage of the join culling capability. See Join Culling in Tableau in this document.
When to Use Custom SQL
When you use custom SQL, Tableau wraps additional GROUP BY, ORDER BY, and WHERE clauses around your query. As a result, custom SQL queries become subqueries. Therefore, use custom SQL only if Tableau cannot generate the desired SQL.
When using custom SQL, consider moving your query to Vertica. To do so, create a view with the query that you would have used in the custom SQL connection and then connect to that view from Tableau.
Note Custom SQL cannot leverage join culling.
Join Culling in Tableau
With join culling, Tableau does not use all joins in your Vertica connection all the time. If you are joining many tables in your connection, using every join would be expensive. Instead, Tableau uses a join only when required. If a join does not impact the result, Tableau discards the join.
Tableau uses join culling automatically on tables that have foreign keys defined in the database. If you do not have foreign keys defined, you can enable join culling for a data source by selecting Assume referential integrity from the Data menu.
For more information, see Assuming Referential Integrity for Joins.
Checking for Well-Constructed Joins
When you create a new connection to Vertica, carefully inspect the relationships and joins that Tableau generates.
By default, Tableau guesses the joins based on the primary and foreign key relationships. These joins may not be correct for certain situations
If the join is not correct, you can alter the join condition.
Cross-Database Joins
Cross-database joins allow you to join tables from multiple databases, such as multiple Vertica databases.
To construct a cross-database join, you need to create a data source with multiple connections, one connection for each database in your join.
Note
It is important to understand that Tableau does not compute the join and aggregations in Vertica. Tableau issues separate queries to each database. Then Tableau transfers the data to the client and computes the joins and aggregations within the Tableau data engine.
Exporting the data out of the source database and computing the query in the Tableau data engine is not as efficient as performing the queries in the source database itself. The performance of your dashboards depends on the number of databases that are joined, and the amount of data transferred.
Tableau Best Practices
The following sections describe techniques you can use to improve performance when connecting to Vertica from Tableau:
- Tips for Dashboard Design
- Tips for Using Parameters
- Tips for Using Filters
- Tips for Calculations
- Tips for Using Sets
Tips for Dashboard Design
Consider the following recommendations for efficient dashboard design in Tableau:
-
An efficient dashboard design combines action filters, data source filters, and parameters.
-
Avoid using filter cards, or use them in moderation. If you use filter cards, use a wildcard text box instead of drop-downs with long lists of values. As an alternative to quick filters, use action filters. Action filters allow you to use visualizations to filter other visualizations. When you use action filters, Tableau sends fewer queries to Vertica.
- Avoid using too many text tables also called cross-tables or Pivot Tables. If you use text tables, make sure they are small.
- If a calculation is complicated in Tableau, aggregate it in Vertica, for example, by using live aggregate projections. Push down the execution of these calculations to the database, and let Tableau create the visualization. See Use Live Aggregate Projections.
- After you have finished designing your dashboards, hide all unused columns from your data sources. Doing so allows your dashboards to load faster when you connect to Vertica.
Tips for Using Parameters
Using parameters for conditional calculations in Tableau allows you to dynamically change a calculation.
Note
If the data changes in your Vertica database, Tableau does not dynamically repopulate the parameters. You need to add new parameter values manually. In addition, Tableau supports only single-value selection for parameters.
Tips for Using Filters
Filters allow you to narrow the data displayed on your dashboard. There are many ways to filter data from your views, for example:
- You can drag a field directly into the Filters shelf and specify the details of the filter in the Filter dialog box.
- You can select specific marks on your visualization, and click on "Keep Only" or "Exclude" on the pop-up menu that appears to filter the selected data.
- You can click on a field's drop-down menu and select "Show Filter". This action displays the filter in the view and users can interact with it.
The following sections provide recommendations for filtering data from Tableau visualizations:
For details about using filters in Tableau, see Filter Data in the Tableau documentation.
Filter Cards
Filter Cards (previously known as Quick Filters) allows you to modify a filter selection directly in the view. To display a filter card, you can click on a field drop-down menu and select "Show Filter". The field is automatically added to the filters shelf and the filter card is displayed so that users can interact with it. You can also click on the drop-down menu of an existing filter and select "Show Filter" to display it.
Consider these recommendations when using filter cards:
- Filter Cards that Do Not Require Extra Queries
- Filter Cards that Require Extra Queries
- Customize Filter Cards with an Apply Button
Filter Cards that Do Not Require Extra Queries
We recommend that you avoid filter cards that require knowledge of the values listed in the filter. Tableau must query Vertica for all potential values before the filter card object can be rendered.
Filter cards that do not require knowledge of the values in the filter list include:
• Custom value list
• Wildcard match
• Relative date filters
• Browse period date filters
Filter Cards that Require Extra Queries
The following filter cards require knowledge of the values listed in the filter:
- Multiple value list
- Single value list
- Compact list
- Slider
- Measure filters
- Ranged date filters
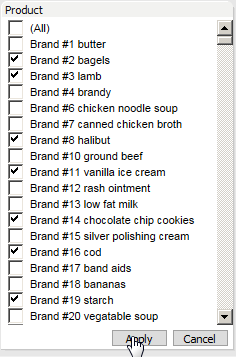
Customize Filter Cards with an Apply Button
We recommend that you use the Apply button in filter cards that consist of large list of values. Doing so prevents Tableau from issuing a query each time the user selects or un-selects an item from the list.
To display the Apply button on your filter card, click the filter card drop-down menu and select "Customize" > "Show Apply Button".
After you customize your filter with the Apply button, select, or deselect multiple values and click Apply. Tableau issues a single query to Vertica that retrieves data based on the selected values.
Filtering Dimensions
- If you are using a filter card to filter a dimension, we recommend that you use a filter card that does not require an extra query like the wildcard filter. For more information, see Filter Cards that Do Not Require Extra Queries.
- If you need to use filter cards and they consist of a large list of discrete values such as a drop-down list or a multi-select list, we recommend using the Apply button, as described in Customize Filter Cards with an Apply Button.
- If your data has numeric dimensions or you define a condition to filter based on numeric values, filter the data using a range of values. Tableau can process a range of values faster than it can process a list of discrete values.
- Avoid filtering data using the Keep Only or Exclude options. The Keep Only and Exclude options force Tableau to scan all the selected data.
Filtering Measures
- For best performance, filter measures using a range of values instead of multiple discrete values.
- If you have a large data source, Tableau recommends that you create a set that contains the measure. You can then apply one or more filters to that set.
Filtering Dates
Date filters are a special kind of dimension filter. The method you use to filter dates impacts the efficiency of the resulting query. There are 3 methods to filter dates:
- Relative date filters—Show a date range that is relative to a specific day.
- Range of date filters—Show a defined range of discrete dates.
- Discrete date filters—Show individual dates that you have selected from a list.
An efficient date filter is one that generates queries with a resulting WHERE clause that uses a ranged date filter. Filtering by date range leverages Vertica partitioning and compression capabilities. We recommend relative or range filters and avoid discrete filters when designing your dashboards.
Context Filters
By default, all filters that you create in Tableau are computed independently and access all rows in your Vertica data source, without regard to other filters.
Context filters behave differently. Tableau implements context filters by writing the filter result set to a temporary table. Any other filters process only the data that the context filter filters and stores in the temporary table.
A context filter must meet the following conditions to ensure optimal performance:
- The context filter must reduce the size of the data set significantly, by filtering 90% of the data.
- The context filter should be used against slow-changing dimensions. If you change the filter, the database must recompute and rewrite the temporary table.
For more information, see Improve View Performance with Context Filters in the Tableau documentation.
Filter Actions and Data Source Filters
As a best practice for building efficient dashboards, consider using filter actions and data source filters as described in the Tableau documentation. Filter actions are an efficient method to filter data and prevent Tableau from issuing expensive unnecessary queries associated with filter cards:
-
Filter actions: Using charts to filter related information between Tableau worksheets.
Note
Use filter actions with the Exclude all values option checked. This reduces the number of queries that are pushed down to Vertica.
- Data Sources filters: Filtering the data on the data source at connection time.
Cross-Data Source Filters
Cross-data source filters allow you to filter data from multiple data sources at once based on a common dimension. By default, any fields that have the same name and data type across the data sources are identified as common or related.
Before filtering the visualizations in your dashboard, Tableau issues separate queries to each data source to identify the values in the filter. If those values do not exist in all related data sources, Tableau excludes them from the list of values in the filter.
For more information, see Filter Data Across Multiple Data Sources in the Tableau documentation.
Tips for Calculations
There are many ways of performing calculations and using Vertica functions in Tableau. The following sections provide some tips:
- Using Tableau Built-In Functions
- Using Table Calculations
- Using Pass-Through Functions
- Using Level-of-Detail Expressions
Using Tableau Built-In Functions
In the Create > Calculated Field interface, functions that display in bold always execute locally in Tableau on the aggregated results. Vertica does not execute these functions. Some examples are:
ASCII
CHAR
FIRST
INDEX
ISDATE
Any function that does not display in bold executes in the Vertica database. Some examples are:
ABS
CONTAINS
DATE
DATEADD
FIND
Regular Expression Functions
Tableau supports Vertica regular expression functions using built-in functions in the Tableau user interface. These functions are described as follows:
| Tableau built-in function | Vertica function called by Tableau function | Comments |
|---|---|---|
| REGEXP_MATCH(string, pattern) | REGEXP_LIKE(string, pattern) | These two functions have the same behavior. |
|
REGEXP_REPLACE(string, pattern, replacement) |
REGEXP_REPLACE(string, pattern, replacement) | These two functions have the same behavior. |
| REGEXP_EXTRACT(string, pattern) | REGEXP_SUBSTR(string, pattern, 1, 1, '', 1) |
When calling REGEXP_SUBSTR, Tableau sets the last parameter, captured_subexp, to 1. Doing so causes REGEXP_SUBSTR to return the substring captured by the first set of parentheses in the regular expression. |
|
REGEXP_EXTRACT_NTH(string, pattern, index) |
REGEXP_SUBSTR(string, pattern, 1, 1, '', index) | You can specify the last parameter of REGEXP_SUBSTR, captured_subexp, using the parameter index in the Tableau function REGEXP_EXTRACT_NTH. To return the entire string that matches the regular expression, set index to 0. |
For detailed information about regular expression functions in Tableau and Vertica, see:
- Regular expression functions in the Tableau documentation
- Regular expression functions in the Vertica documentation
How Regular Expression Functions Work
When you call a Tableau built-in function, Tableau uses the corresponding Vertica function in Vertica. Vertica executes the function and returns the results to Tableau. Tableau displays the results in the dashboard as you specify.
Let's look at an example. Suppose you want the portion of a string that matches the first set of parentheses in the regular expression. When you use REGEXP_EXTRACT in your dashboard, it calls REGEXP_SUBSTR, with the last parameter, captured_subexp, set to 1. The REGEXP_EXTRACT function looks like this:
REGEXP_EXTRACT('abc 123', '[a-z]+\s+(\d+)') = '123' -- Tableau function
REGEXP_EXTRACT generates a query like the following and sends it to Vertica for execution. You cannot change this query:
SELECT REGEXP_SUBSTR('abc 123', '[a-z]+\s+(\d+)', 1, 1, '', 1)
Now suppose you want the full string that matches the regular expression. For this, call the Tableau function REGEX_EXTRACT_NTH with the index parameter set to 0:
REGEXP_EXTRACT_NTH('abc 123', '[a-z]+\s+(\d+)', 0) = 'abc 123' --function in Tableau
The Tableau function REGEX_EXTRACT_NTH, with the index parameter set to 0, generates a query that calls the Vertica function REGEXP_SUBSTR with the captured_subexp parameter set to 0. This query returns the full string that matches the regular expression:
SELECT REGEXP_SUBSTR('abc 123', '[a-z]+\s+(\d+)', 1,1, '', 0) = 'abc 123' –-function in Vertica
For more details, see REGEXP_SUBSTR in the Vertica documentation.
Using Table Calculations
Table calculations execute only in Tableau and can transfer large data sets out of Vertica. Some examples are:
RUNNING_SUM
WINDOW
We recommend that, you use Level-of-Detail (LOD) expressions that can achieve the same results. LOD expressions execute in Vertica, which allows them to leverage your database speed.
Using Pass-Through Functions
Tableau does not support all database functions that Vertica provides. If a function is not available in Tableau, use pass-through functions to push the function to Vertica.
For example, Tableau does not have a MOD or a MEDIAN function. Use RAWSQLAGG_REAL to compute MOD or MEDIAN at the database level. RAWSQLAGG_REAL pushes down Vertica functions that return real values, such as MOD and MEDIAN.
For a complete list of Vertica functions, see the Vertica documentation.
For a complete list of Tableau pass-through functions, see the Tableau documentation.
Pass-Through Function Example
To use a Tableau pass-through function to run APPROXIMATE COUNT DISTINCT, create a calculated field:
- Right-click a field and select Create > Calculated Field.
- Select Pass Through from the Functions drop-down list.
- Select RAWSQLAGG_REAL.
Enable Non-DBADMIN Users for Pass-Through Functions
To enable Vertica non-DBADMIN users to access pass-through functionality, add the public schema to the user's search path:
=> ALTER USER tableau_user SEARCH_PATH public, tableau_user_s;
Using Level-of-Detail Expressions
If you are working with large data sets, we recommend that you use Level-of-Detail (LOD) expressions instead of table calculations. Tableau does not execute table calculations in Vertica.
Level-of-detail calculations are a type of calculation, that allows users to compare data at several different aggregation levels. For example, you might want to compare the number of dropped calls in a certain area of the country to the total number of dropped calls.
LOD expressions generate queries that Vertica computes. These queries include subqueries with inner joins and sometimes with cross joins.
For more information about LOD expressions, see the Tableau documentation:
Tips for Using Sets
Sets in Tableau are useful when you want to compare two or more data sets. However, sets do not push query execution down to Vertica. You should use sets only when working with small data sets.
For more information, see the Tableau documentation.
Vertica Tuning Recommendations
Consider the following techniques for improving Vertica performance with Tableau:
- Upgrade Vertica for More Efficient Query Processing
- Create a Physical Design with Database Designer
- Use Live Aggregate Projections
- Manage Vertica Resource Pools
- Enable Database Isolation Levels in Tableau
- Enable Native Connection Load Balancing in Vertica
Upgrade Vertica for More Efficient Query Processing
Tableau issues system-related queries to obtain metadata on Vertica tables. Vertica Server latest versions optimize such queries. For more efficient query processing from Tableau to Vertica, upgrade Vertica to the latest version.
Create a Physical Design with Database Designer
To get the best performance from your Vertica database, create a physical design for your database that optimizes both query performance and data compression.
Database Designer automatically optimizes your physical design.
Database Designer minimizes the time you spend on manual database tuning and provides the ability to redesign the database incrementally to optimize for changing workloads over time.
For more information, see Using Database Designer.
Identify Sample Queries for Database Designer
You can submit sample queries to Database Designer before it creates or updates a physical design. If some queries are executing slowly, Database Designer can create a physical design that optimizes those slow queries.
You can use Tableau to identify queries that are good candidates for the Database Designer in several ways:
- Use Tableau Performance Recorder, as described in Using Tableau Performance Recorder.
- Inspect the logs, as described in Examining Log Files
-
Run SQL queries against the Vertica Data Collector tables.
The following query returns the 10 slowest queries from the system:
=> SELECT request FROM v_monitor.query_requests
	WHERE request_type = 'QUERY'
       ORDER BY request_duration_ms DESC LIMIT 10;
The following query returns the 10 most frequently executed queries:
=> SELECT request FROM (SELECT request, COUNT(request) cnt
	FROM v_monitor.query_requests
	WHERE request_type = 'QUERY'
	GROUP BY request) T
	ORDER BY cnt DESC LIMIT 10;
- Monitor queries in Management Console to better understand resource utilization when queries are executing.
For more information, see Configuring Resource Pools in Management Console
Check Database Designer Projections
After Database Designer creates a database design, examine the log files and review the projections. You can find data about the projections that Database Designer considered and deployed in two Data Collector tables:
DC_DESIGN_PROJECTION_CANDIDATES
DC_DESIGN_QUERY_PROJECTION_CANDIDATES
Verify that the projections are sorted on columns of importance according to the WHERE clauses of your sample queries. Low-cardinality columns should be encoded.
Use Live Aggregate Projections
When you create a live aggregate projection for a table, Vertica automatically aggregates data from that anchor table and loads it into the live aggregate projection. Because the data is already aggregated, retrieving the data directly from the live aggregate projection is faster than retrieving it from the anchor table.
Note
Once you create a projection, run the START_REFRESH or REFRESH function to load the data into the projection.
To access a live aggregate projection from Tableau, create a view and access the view from Tableau:
=> CREATE VIEW <projection_name> ASSELECT * FROM <projection_name>
For information on creating live aggregate projections, see Live Aggregate Projections
Manage Vertica Resource Pools
You can use Vertica resource pools to manage the use of database resources by your Tableau applications. You can create a separate resource pool for Tableau, and you can define secondary (cascading) resource pools to handle queries that do not return within a given time limit.
Create a Separate Resource Pool for Tableau
Vertica recommends that you create a separate resource pool and user for your Tableau application. Doing so reduces the impact of other applications such as ETL jobs on your queries.
The actual impact depends on the amount of memory on the machine and other factors such as how many other resource pools are created for other users.
The following example shows how to create and manage access to the TABLEAU_ POOL resource pool:
=> GRANT USAGE ON SCHEMA tableau_s TO tableau;
=> GRANT USAGE ON SCHEMA PUBLIC TO tableau;
=> GRANT USAGE ON SCHEMA online_sales TO tableau;
=> GRANT USAGE ON SCHEMA store TO tableau;
=> GRANT SELECT ON ALL TABLES IN SCHEMA PUBLIC TO tableau;
=> GRANT SELECT ON ALL TABLES IN SCHEMA store TO tableau;
=> GRANT SELECT PN ALL TABLES IN SCHEMA online_sales TO tableau;
=> GRANT ALL PRIVILEGES ON SCHEMA tableau_s TO tableau WITH GRANT OPTION;
=> GRANT CREATE ON SCHEMA tableau_s TO tableau;
=> GRANT USAGE ON RESOURCE POOL tableau_pool TO tableau;
=> ALTER USER tableau RESOURCE POOL tableau_pool;
For more information, see Resource Manager in the Vertica documentation.
Create a Cascading Resource Pool
When you create a resource pool, you assign a RUNTIMECAP that specifies the amount of time a query should run in that resource pool before it times out. If a query exceeds the RUNTIMECAP, it errors out. However, if you have defined a secondary pool, the query continues executing in the secondary pool.
To designate a secondary pool, use the CASCADE TO parameter in the ALTER RESOURCE POOL or CREATE RESOURCE POOL statement.
For example, suppose you have a resource pool assigned to the Tableau user:
=> ALTER USER tableau RESOURCE POOL tableau_pool;
If the tableau_pool resource pool is not adequate, create a second resource pool (tableau_pool_backup) for overflow query execution:
=> CREATE RESOURCE POOL tableau_pool_backup RUNTIMECAP '5 minutes';
=> ALTER RESOURCE POOL tableau_pool CASCADE TO tableau_pool_backup;
For more information about cascading resource pools, see Defining Secondary Resource Pools in the Vertica documentation.
Enable Database Isolation Levels in Tableau
By default, Vertica uses the READ COMMITTED isolation level for every session. If your database has a different isolation level than READ COMMITTED, you might experience table locks.
To change the default isolation level for the database, set the TransactionIsolation configuration parameter in the Tableau Datasource Customization (TDC ) file. The following examples show how to set the isolation level to READ COMMITTED:
<!-- METHOD 1 -->
<customization name='CAP_SET_ISOLATION_LEVEL_VIA_ODBC_API' value='yes' />
<customization name='CAP_ISOLATION_LEVEL_READ_COMMITTED' value='yes' />
<!-- METHOD 2 -->
<customization name='odbc-connect-string-extras' value='TransactionIsolation=Read Committed;'/>To change the default isolation level for a specific session in vsql, use SET SESSION CHARACTERISTICS command:
=> SET SESSION CHARACTERISTICS AS TRANSACTION ISOLATION LEVEL READ COMMITTED;
For details, see Customize Your Connection to Vertica in this document.
For information about Vertica isolation levels, see Change Transaction Isolation Levels in the Vertica documentation.
Enable Native Connection Load Balancing in Vertica
Native connection load balancing is a Vertica feature that spreads the CPU and memory overhead caused by client connections across the hosts in the database.
Vertica does not use load balancing by default. To use load balancing, you must explicitly enable it in both the server and the client sides.
Once you have enabled load balancing on your Vertica server, make the following change to the Tableau Datasource Customization (TDC) file:
<customization name='odbc-connect-string-extras' value='ConnectionLoadBalance=1' />For more information about native connection load balancing, see About Native Connection Load Balancing in the Vertica documentation.
Customize Your Connection to Vertica
Follow the recommendation in this topic to customize Tableau for connecting to Vertica:
- About TDC Files
- Customize Tableau ODBC Capabilities
- Customize Vertica’s ODBC Connection Properties
- Applying Global Data Source Customization
About TDC Files
You can use a Tableau Data source Customization (TDC) file to investigate issues with your connection to Vertica and customize Vertica’s connection properties. A TDC file applies customizations globally to all connections to Vertica.
Note
Tableau’s built-in connector for Vertica also known as the Native Connector for Vertica, has been designed for optional performance. Any customizations must be performed on a case-to-case bases.
Important
Once you create Tableau customization files, you must maintain them manually, editing them any time you need to change them. Because of this, you should use these files judiciously, relying on them only when you detect connection issues that you want to investigate further.
For more information about customizing and Tuning ODBC connections in Tableau, see the Tableau documentation.
Customize Tableau ODBC Capabilities
You can modify Tableau ODBC capabilities on a case-to-case bases. These capabilities specify the behavior of Tableau when issuing queries and the type of SQL it generates.
These are some examples of customizations you can apply in a TDC file.
| Customization name | Recommended value |
| CAP_CREATE_TEMP_TABLES |
Set to 'no' so that Tableau does not create temporary tables. See also: CAP_SELECT_INTO. |
| CAP_ISOLATION_LEVEL_READ_COMMITTED |
Set to 'yes' to force the transaction isolation level to Read Committed. Apply only if you are experiencing lock issues. |
| CAP_ODBC_EXPORT_ALLOW_CHAR_UTF8 | Set to 'yes' to allow the single-byte char data type for binding Unicode strings as UTF-8. This setting does not impact performance with Vertica. |
| CAP_ODBC_METADATA_SUPPRESS_EXECUTED_QUERY |
Set to 'yes' for Vertica versions prior to 7.1. Prior versions to 7.1 do not optimize metadata queries that Tableau issues at connection time. Refer to Upgrade Vertica for More Efficient Query Processing. |
| CAP_QUERY_SUBQUERY_QUERY_CONTEXT |
Set to 'yes' to force Tableau to use a subquery for context filters instead of a temporary table or locally cached results. We recommend this setting if you are using context filters in your dashboards. Example: |
| CAP_SELECT_INTO |
Set to 'no' so that Tableau does not create a table on the fly from the result set of another query. See also: CAP_CREATE_TEMP_TABLES. Example: |
Customize Vertica’s ODBC Connection Properties
You can modify Vertica’s ODBC connection properties using the odbc-connect-string-extras customization, as shown in the examples below.
Note This customization is case sensitive. Make sure that odbc-connect-string-extras is always lowercase.
Define a session label:
<customization name='odbc-connect-string-extras'
value='Label=tableau_session_label'/>
Change the result buffer size:
<customization name='odbc-connect-string-extras'
value='ResultBufferSize=500000'/>
Enable Native Connection Load Balancing:
<customization name='odbc-connect-string-extras'
value='ConnectionLoadBalance=1'/>
Specify database isolation:
<customization name='odbc-connect-string-extras'
value='TransactionIsolation=Read Committed'/>
Specify SSL Server Authentication mode:
<customization name='odbc-connect-string-extras'
value='SSLMode=require'/>
Note SSL Mutual Authentication has not been tested.
If you want to customize multiple parameters, you can add one after the other separated by semicolon, as in this example:
<connection-customization class='vertica' enabled='true'
   version='any value'>
   <vendor name='vertica' />
   <driver name='vertica' />
   <customizations>
	<customization name='odbc-connect-string-extras'
	value= 'Label=tableau_session_label;ConnectionLoadBalance=1' />
   </customizations>
</connection-customization>
Note The value you specify for version in the connection-customization section is ignored by Tableau, but a value is required.
For a complete list of Vertica’s ODBC connection properties, see ODBC Connection Properties.
Applying Global Data Source Customization
To modify the connection behavior for all data sources connecting to Vertica, create a Tableau Datasource Customization (TDC) file. The TDC file contains a <connection-customization> section that Tableau applies to any connection to Vertica.
Tableau Desktop automatically embeds the content of the *.tdc file in the workbook file (*.twb).
When you publish the Tableau workbook to Tableau Server or Tableau Cloud, the workbook uses the customizations that you specified in your custom TDC file. You do not need to manually create a *.tdc file in Tableau Server.
To overwrite any customized settings, create a new TDC file. However, if you delete this new TDC file, Tableau Desktop uses the settings in the original custom TDC file, even if that file no longer exists.
Creating a TDC File
To create a TDC file, follow these steps:
-
Create a new file in the Datasources directory of the Tableau repository:
My Tableau Repository/Datasources, and name the file using the .tdc suffix. -
Copy and paste the following into the TDC file:
<connection-customization class='vertica' enabled='true' version='any value'>
   <vendor name='vertica' />
   <driver name='vertica' />
   <customizations>
      <customization name='CAP_QUERY_SUBQUERY_QUERY_CONTEXT' value='yes' />
      <customization name='odbc-connect-string-extras'
value='Label=TableauLbl;ConnectionLoadBalance=1;BackupServerNode=10.0.50.153,10.0.50.151' /> </customizations> </connection-customization>
Note This example sets CAP_QUERY_SUBQUERY_QUERY_CONTEXT to yes. To force Tableau to use a subquery for context filters instead locally cached results. Vertica strongly recommends this setting if you use context filters in your workbooks.
This example also sets a session label using the customization 'odbc-connect- string-extras' and enables connection load balancing.
-
Save and close the .tdc file.
Edit the TDC File
To remove all customizations, you must manually edit the *.twb file:
- Delete any custom *.tdc files.
- Edit the *.twb file to reset the customizations to the desired settings.
Check that the TDC File Settings are Applied
To verify that the customizations in the TDC file have been applied to your connection, take these steps:
- Delete all log files in: My Tableau Repository\Logs.
- Open Tableau Desktop and connect to any table in Vertica. Open an existing workbook or create a new one.
- Close Tableau.
- Open your Tableau log file.
- Search for the name of the customization you applied to your connection. For example, search for CAP_QUERY_SUBQUERY_QUERY_CONTEXT.
Tableau Single Sign-On (SSO) to Vertica Using Kerberos
In a Single Sign-On solution using Kerberos, the access to Tableau Desktop, Tableau Server, and Vertica is handled by the Active Directory authentication service. Once a user signs into their computer (Windows or Linux), each additional log on is handled automatically, simplifying the authentication process to Tableau and Vertica.
Note For testing this scenario we used the following configuration:
- Vertica and Tableau Server were configured for Kerberos authentication.
- We used Tableau Server on Windows. Tableau Server on Linux also supports SSO to Vertica using Kerberos, however, we have not tested that environment.
- We use a Single domain environment. The users (browser), Tableau Server, and Vertica database are on the same domain. We have not tested a cross domain environment.
Kerberos Constrained Delegation
Tableau Server supports constrained delegation for authentication to Vertica. Kerberos Constrained delegation enables Tableau Server (Run as Service Account) to execute queries in Vertica on behalf of the user/viewer of a workbook. The domain user/viewer that accesses the workbook from Tableau Server (via the browser) is displayed in the session’s system table in Vertica.
Note If Kerberos and Constrained Delegation has been correctly configured, you will be able to select the Viewer Credentials authentication option in Tableau Desktop when publishing a workbook.
- To configure Vertica for Kerberos authentication, see Kerberos Authentication.
- To configure Tableau Server for Kerberos authentication, see Kerberos.
- For an overview of Kerberos constrained delegation, see Enable Kerberos Delegation.
- To enable Kerberos Constrained Delegation for Vertica, see Enabling Kerberos Delegation for Vertica.
- To Troubleshooting Kerberos, see Troubleshoot Kerberos.
Troubleshooting Tools
This section includes the following information to help you in troubleshooting:
Using Tableau Performance Recorder
Use the Tableau Performance Recorder to view the performance of the queries that Tableau generates and sends to Vertica. With this information, you can identify queries that are good candidates to submit to Vertica's Database Designer. When you run Database Designer, it creates projections that optimize the performance of those sample queries.
Run Performance Recorder first on your Tableau Desktop machine. If your workbook is slow in Tableau Desktop, it will be slow in Tableau Server. Before you run Performance Recorder on Tableau Server, restart Tableau Server to eliminate caching and inaccurate results. Then run Performance Recorder on Tableau Server.
Many factors can affect Tableau Server performance, including network latency. To identify if network latency is the problem:
- Install Tableau Desktop on the Tableau server machine.
- Run Performance Recorder using Tableau Desktop on the Tableau Server machine.
- Compare the performance to the Performance Recorder results on the Tableau Desktop machine.
Note The Tableau Performance Recorder helps you identify what events are affecting performance.
If the bottleneck is query execution (retrieving the data), follow the recommendation in Vertica Tuning Recommendations in this document.
If the bottleneck is in creating the visualizations and the dashboard layout, follow the recommendation in Tableau Best Practices in this document.
For more information about Tableau Performance Recorder, see the Tableau documentation.
Using Session Labels
When troubleshooting, you can identify connections by configuring a session label.
To configure a Tableau session label, use the connection attribute customization odbc- connect-string-extras in the TDC file. Once you have configured a session label, all sessions that Tableau creates will have this label.
To configure a session label in a TDC file, add this customization:
<customization name='odbc-connect-string-extras' value='Label=tableau_session_label'/>'
Examining Log Files
To monitor the performance of SQL queries that Tableau sends to Vertica, capture the following log files while reproducing your issues with Tableau:
- Vertica ODBC Driver Log File
- ODBC Tracing
- Vertica Log File
- Tableau Desktop Log File
- Tableau Server Log File
Vertica ODBC Driver Log File
This log contains the messages between the Vertica ODBC driver and the Vertica Server. To begin recording this log, edit the values of the parameters LogLevel and LogPath. In MacOS or Linux, edit the vertica.ini file. In Windows, edit the registry in Computer\HKEY_LOCAL_MACHINE\SOFTWARE\Vertica\ODBC\Driver. For more information see Configuring ODBC Logs.
ODBC Tracing
The ODBC Driver Manager has a trace facility that records the sequence of function calls that an ODBC application makes. In this case Tableau is the application making the ODBC calls.
Follow these steps to enable ODBC tracing:
- Before you start ODBC tracing, close Tableau.
-
Open the ODBC Data Source Administrator tool. Find the icon for Data
Sources (ODBC) in the Control Panel under Administrative Tools.
- Click the Tracing tab.
-
Click Start Tracing Now to enable tracing. The button then changes to Stop Tracing Now.
Specify the name and full path to the log file in the Log File Pathtext box.
- Click OK.
- Open Tableau to interact with your visualizations. The ODBC tracing starts capturing all calls between Tableau and the Driver Manager, and between the Driver Manager and the ODBC driver.
- Close Tableau.
- To stop tracing, in the ODBC Data Source Administrator tool, click Stop Tracing Now.
- Review the content of the generated ODBC log file.
Vertica Log File
Vertica records all database events in a log file. An example of the path to the Vertica log file is:
/home/dbadmin/vmart/v_vmart_node0001_catalog/vertica.log
For more information, see the Monitoring Log Files in the Vertica documentation.
Tableau Desktop Log File
If you have a slow workbook, the Tableau log file might help you identify the problem. To determine if a slow query is causing a slow workbook, test the query generated by Tableau directly in vsql.
An example of the path to the log file on Windows is:
C:\Users\<my_user>\Documents\My Tableau Repository\Logs\log.txt
To find the problematic query in the log file on Windows is:
- Close Tableau Desktop.
- Navigate to the location of the logs and delete all the files in that folder.
- Open Tableau Desktop.
- Perform the steps that cause the problematic query to execute.
- Close Tableau Desktop.
- Navigate to the location of the logs and open the log.txt file.
- Search for the name:value pair "query":"<my_query>", where <my_query> is the problematic query you want to investigate.
- Extract the query from the log and run the query in vsql.
Note If the performance in vsql is similar to the performance in Tableau, you may need to rewrite the query.
Tableau Server Log File
In Tableau Server, the log files related to connecting and querying Vertica are in the following location for Windows:
C:\ProgramData\Tableau\Tableau Server\data\tabsvc\Logs\vizqlserver
For details about Tableau Server log files, see Work with Log Files in the Tableau documentation.
For More Information
- Tableau Documentation
- Tableau User Community
- Vertica Integration with Tableau: Connection Guide
- Vertica QuickStart for Tableau
- Vertica Partner QuickStart for Tableau: Ticket Tracking
- Vertica Community Edition
- Vertica User Community
- Vertica Documentation

