


Monitoring Solution with Vertica and Prometheus Using Grafana
This video provides an end-to-end monitoring solution with two Vertica open-source projects – Vertica Grafana Plugin and Vertica Prometheus Exporter. It demonstrates how you can get your Vertica metrics in Prometheus and use either Prometheus or Grafana to visualize these metrics based on what your requirement is. Check out the video for more details!
Prometheus is an open-source systems monitoring and alerting toolkit. Since its inception in 2012, many companies and organizations have adopted Prometheus, and the project has a very active developer and user community. Prometheus collects and stores its metrics as time series data, that is, metrics information is stored with the timestamp at which it was recorded, alongside optional key-value pairs called labels.
Customers asked for a way to capture Vertica metrics in Prometheus, which then gives them the option to visualize and monitor these metrics and the rest of their infrastructure in a unified dashboard environment such as Grafana.
Grafana allows you to query, visualize, alert on, and understand your metrics no matter where they are stored. Grafana takes a unique approach to providing a “single-pane-of-glass” by unifying your existing data, wherever it lives.
We developed the vertica-prometheus-exporter as a solution to this need. The exporter is an open-source project. It uses collector files to map Vertica sql query results to Prometheus format, and it has HTTP capabilities so it can act as a target for Prometheus.
This document provides an end to end solution on how to use the vertica-prometheus-exporter to scrape metrics from Vertica system tables, have Prometheus use the exporter as a target, and visualize the metrics stored in Prometheus in a Grafana dashboard.
The following diagram illustrates the high level workflow of this solution. The vertica-prometheus-exporter pulls metrics from Vertica into the Prometheus monitoring system. The configurations that you need to make in the exporter and Prometheus are explained in detail in this guide. You can configure and set up based on what is critical for you to track and visualize. In our testing, we used Grafana to visualize data as it has a proven integration with Prometheus. There could be other tools that can use Prometheus as a data source.

Scope
The assumptions in this document are that the reader is familiar with Linux, Vertica, Prometheus, and Grafana.
This document does not cover installation of Vertica, Prometheus, or Grafana. It shows the installed exporter’s directory structure and key files to be aware of. It also covers configuration and running of each piece of the stack to get the Vertica metrics visualized in Prometheus and Grafana.
More in depth details on the exporter can be found at the vertica-prometheus-exporter Github page in the README.md file and files in the documentation folder.
Our Test Environment
-
Vertica 12.0.1 installed on a 3 node Linux VM cluster with the VMart example database.
-
vertica-prometheus-exporter 1.0.2 tarball installed on a Linux VM.
-
Prometheus 2.25.0 installed on a Linux VM.
-
Grafana 9.0.2 installed on a Linux VM with the Prometheus data source 5.0.0 plugin.
This solution guide is categorized based on three main sections:
You can expand and collapse topics for more details as you go along reading the guide.
Using the Vertica Prometheus Exporter
The vertica-prometheus-exporter is a configuration-driven exporter that exposes metrics gathered from a Vertica database for use by the Prometheus monitoring system, and tools that support Prometheus as a data source, such as Grafana. The exporter is written in the GO programming language and uses the Vertica-sql-go driver to connect to the Vertica database.
The core concept of this exporter is based on the idea that a proper Vertica query can easily be mapped onto a set of labels and one or more numeric values that make up a valid Prometheus metric.
Some of the key features of the vertica-prometheus-exporter are:
-
Two types of distributions on Github.
-
Tarball: Small footprint tar file with binary, doc, license, config and example files.
-
Full source: Allows build of non-Docker binary or optimized Docker container.
-
-
Currently supports Linux amd64 deployments.
-
Verbose logging with knobs for adjusting retention by time and/or size.
-
Collector files can have their own cache intervals to optimize number of connections and frequency of queries against Vertica.
-
End user defines their own desired metric set(s) and caching.
-
Open source so users can share their bug fixes, enhancements, and metrics collector files via the Github community.
Using Tarball or Source Distribution
The vertica-prometheus-exporter comes in two distribution types. The tarball which is a precompiled minimal footprint, and the source which is the complete source code. Following are the top level directory trees of both distributions as a comparison.
Tarball:
[dbadmin@exporter ~]$ ls vertica-prometheus-exporter-v1.0.2.linux-amd64
documentation  LICENSE  logfile  metrics  README.md  vertica-prometheus-exporter
Source:
[dbadmin@exporter ~]$ ls vertica-prometheus-exporter-1.0.2
cmd           config           Dockerfile     errors    exporter.go  go.sum  LICENSE   metric.go  README.md  target.go  VERSION collector.go  CONTRIBUTING.md  documentation  examples  go.mod       job.go  Makefile  query.go   sql.go     test
Some files of note reside in the exporter’s metrics directory. They are as follows:
-
vertica-prometheus-exporter.yml– The exporter configuration file with global settings for connections, min_interval cache, connect string, collector files, and logs. -
vertica-example.collector.yml– Metrics examples that one might visualize in a gauge, example, license size, db size, number of nodes down. -
vertica-example1.collector.yml- Metrics examples that one might visualize in a graph, example, connections per node, network or IO RX and TX traffic.
Configuring Global Settings - vertica-prometheus-exporter.yml
There are two main parts to the global configuration file vertica-prometheus-exporter.yml.
-
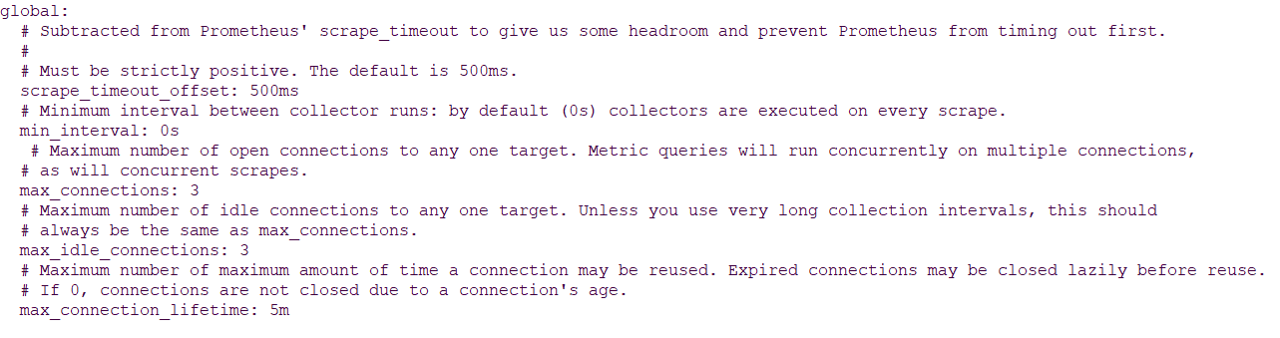
The top of the file is the “global” section where the connection and scrape settings are.
Here you can limit the number of connections to Vertica and set the min_interval cache duration. We will leave all the settings in this section at the default. Note that the min_interval is set globally to “0”.
-
The bottom of the file contains the “target”, “collector_files”, and “Log” sections.
This is where you set your data source name (connect string) to Vertica, including any parameters you want such as, load balancing. Also, you can list the specific collector files to load and their file names.

data_source_name
For this solution we will modify the data source name to fit our specific environment. The data source name format is the same as for the vertica-sql-go driver it uses. “ vertica://(user):(password)@(host):(port)/(database)?(queryArgs)”.
collectors: [example ,example1]
The collectors key lists the two example collector files supplied with the exporter. We will use the default.
collectors: [example ,example1]
Note The names in this list must match the collector_name values in the collector files key value.
[dbadmin@exporter vertica-prometheus-exporter-v1.0.2.linux-amd64]$ head -5 metrics/vertica-example.collector.yml
collector_name: example
[dbadmin@exporter vertica-prometheus-exporter-v1.0.2.linux-amd64]$ head -5 metrics/vertica-example1.collector.yml
collector_name: example1
The collector_files key uses a global file spec. We will use the default.
collector_files: - "*.collector.yml"
Note The two collectors listed in the collectors key must exist in the metrics directory and match the collector_files key names, or in this case the glob naming specified.
[dbadmin@exporter vertica-prometheus-exporter-v1.0.2.linux-amd64]$ ls metrics/*collector.yml
metrics/vertica-example1.collector.yml  metrics/vertica-example.collector.yml
Configuring Metric Collection - vertica-example.collector.yml and vertica-example1.collector.yml
Following are some extracts of metrics definitions in the two collector example files we supply with the exporter distibutions, vertica-example.collector.yml and vertica-example1.collector.yml.
-
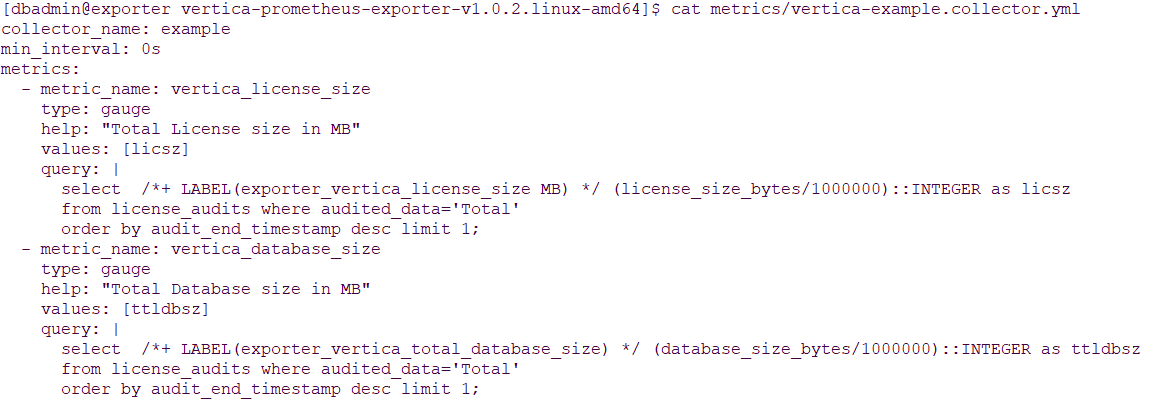
In
vertica-example.collector.ymlyou can see that the min_interval is set to the global default of “0s”. This means no caching of values, so each scrape by Prometheus results in fresh metrics collection from Vertica. You can also see that each metric has its own sql query, which means each time a refresh occurs there is a connection and query execution for each metric. -
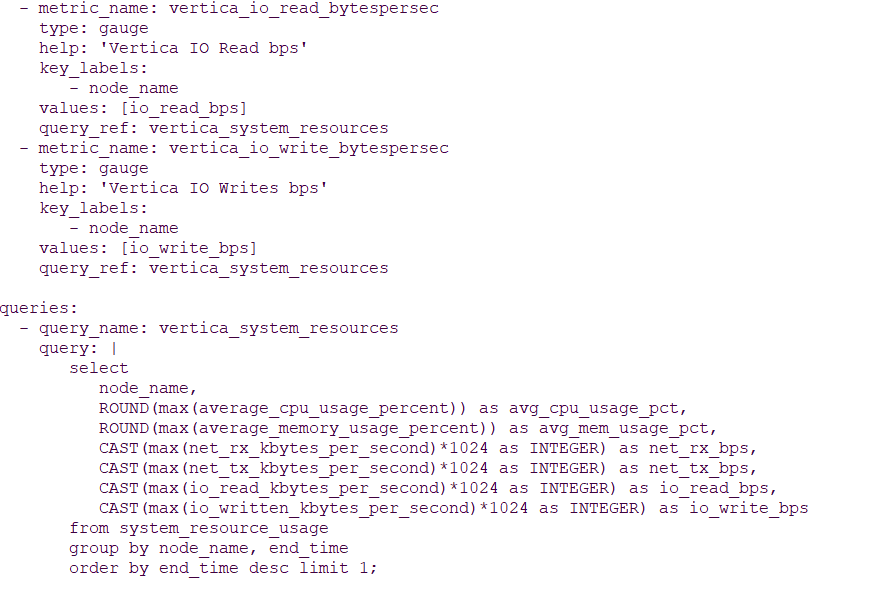
In
vertica-example1.collector.ymlyou can see that the min_interval is set to “90s”. This means there is caching of values, and each scrape by Prometheus results in a cache age comparison with the min_interval, and only if the age exceeds the min_interval is a fresh metrics collection from Vertica performed. See Notes below for more detail.

Also in the vertica-example1.collector.yml you can see that each metrics uses a query_ref which points to a single query including the columns desired. In this file there are actually 6 metrics that all reference the one query, so a Prometheus scrape resulting in a fresh metrics collection from Vertica would be one connection and query vs. six.
Note
The min_interval for example is the same as the global value, but the one in example1 is different and overrides the global setting. The 90s means that for all metrics in this collector, the results will be cached in memory for 90 seconds. Any request coming in during the 90s seconds will get what is in cache. Any request coming in after 90 seconds will force the exporter to start a new cache and scrape fresh values from Vertica.
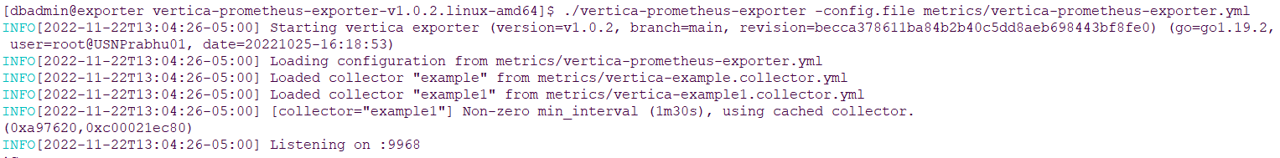
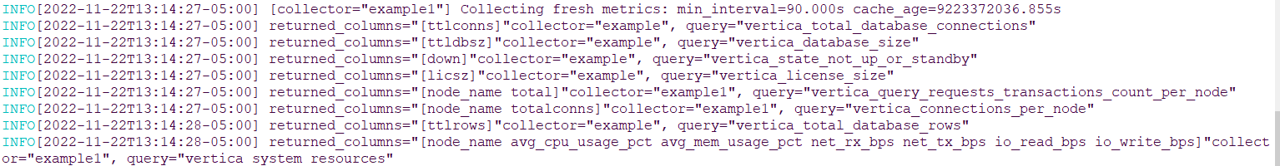
You start the exporter by passing it the configuration file. In this startup output, you can see that it starts, outputs some version and build information, loads the collector files, posts that example1 is using a min_interval cache setting, and starts listening on port 9968.
Note You can start the exporter using nohup so it runs in the background after you disconnect your terminal session.
Once the exporter is started you can directly access it to confirm it is working using CURL. You will get the metrics HELP, TYPE, and labeled results.
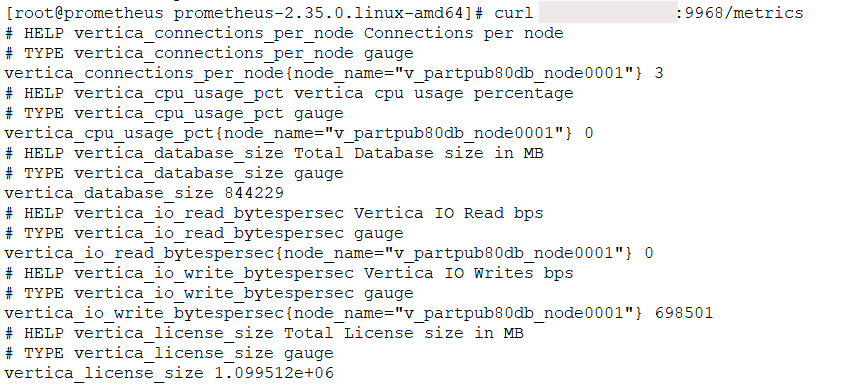
Note that in the exporter output it shows it is collecting fresh metrics as this is the first collection and there is no cache at the start.
Now if you run the curl command, wait 15 or 20 seconds, and run it again. In the exporter output, it shows it is using cached metrics for example1 with min_interval set to 90s, and collecting fresh metrics for example with min_interval set to 0.

Setting Up Prometheus and Visualizing Vertica Metrics
This section explains how you can set your targets and configure Prometheus to scrape metrics and then visualize it using tables and graphs that Prometheus offers.
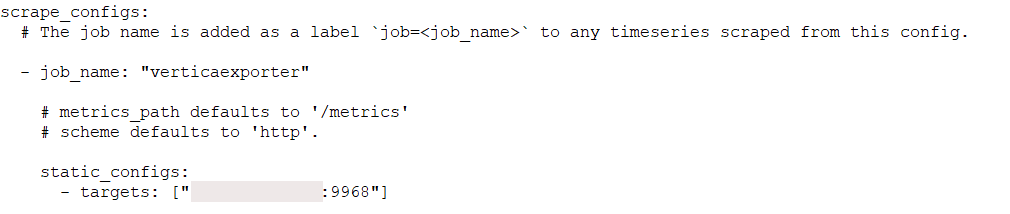
Prometheus has a configuration file Prometheus.yml. In this file, there is a “scrape_config” section. This is where you set up your targets you want Prometheus to scrape. A target typically would have a job name and a static_config.
In this case we set the jobname to “verticaexporter” and the scrape_config targets to our exporter listening on port 9968.
Note Prometheus has a global scrape_interval setting. This will represent how often it scrapes the listed targets. The default is every minute and you can adjust this to meet your metrics needs. You can also specify it in the scrape_config for each target if you have multiple targets and differing interval needs.
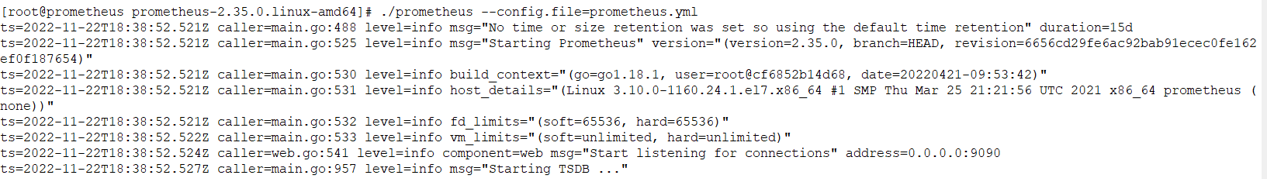
Prometheus is started by passing it the configuration file. It posts some version information, reads its configuration file, starts its internal database, and starts listening on port 9090.

Note You can start Prometheus using nohup so it runs in background after you disconnect your terminal session.
Prometheus has a web interface for administering and monitoring the server.
One of the views available is Status > Targets.
It gives a list of targets that are loaded from the configuration file and their current status. We can see verticaexporter listed here (the job name we set in the configuration file) is up.
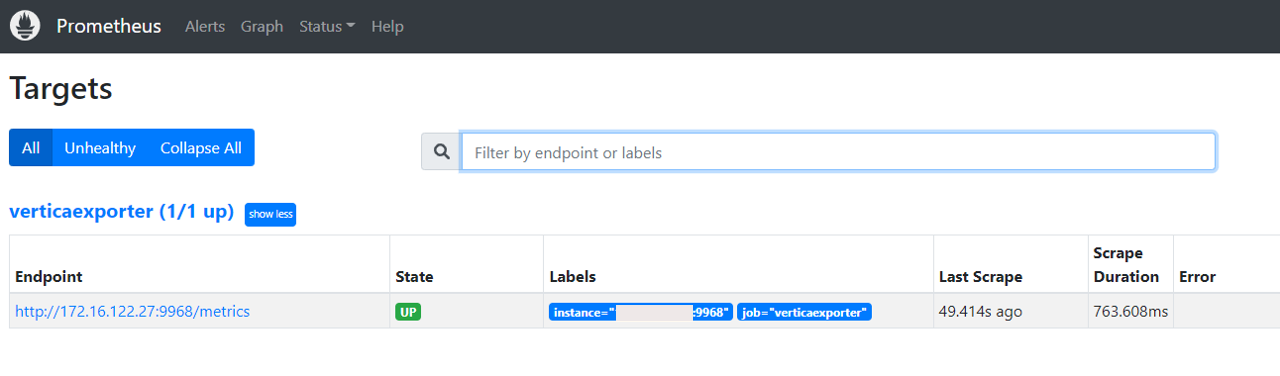
If you click the hyperlink for the verticaexporter, a metrics screen appears.
Note This is the same screen we saw using CURL directly against the exporter. You can use the CURL method to debug things and get them as desired, then you can add as a target to Prometheus with confidence of the results.

Prometheus has some rudimentary table and graph capabilities. You can use this to view simple visualizations of your Vertica metrics.
-
In the Prometheus web interface select the Graph menu.
-
Select Table.
-
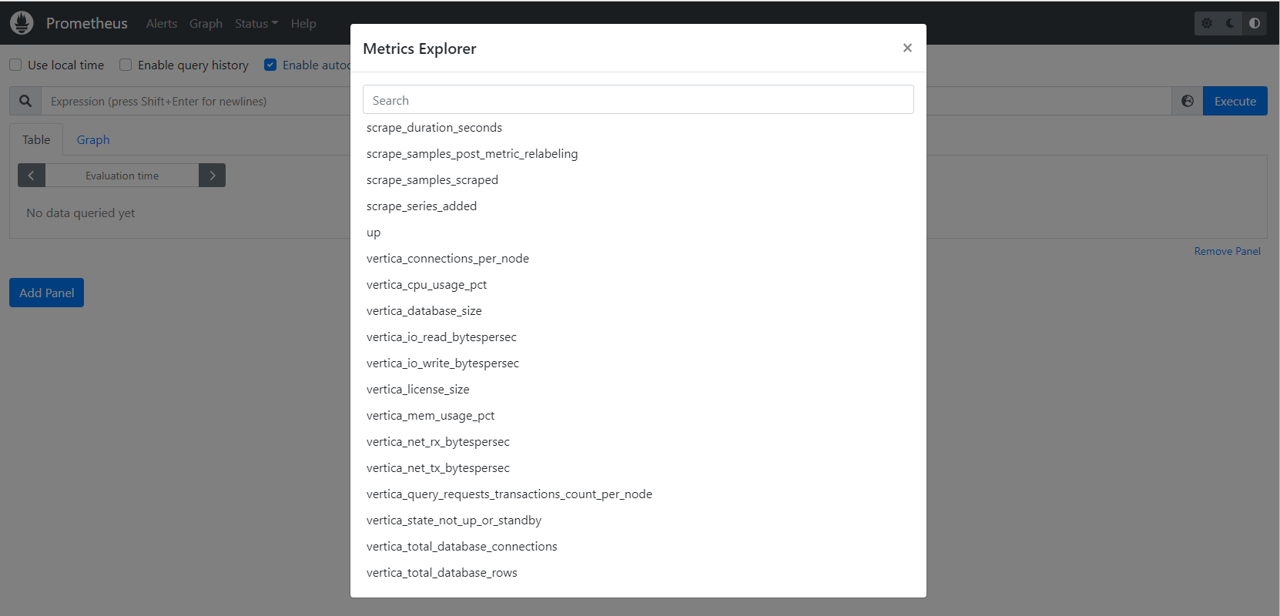
On the far right of the Expression field is an “eye” icon. Click it to open the Metric Explorer.
You can see a list of Vertica metrics the explorer is scraping and formatting for Prometheus.
-
In this example we chose the
vertica_query_requests_transactions_count_per_nodemetric. -
Click Execute.
The results are displayed in the Prometheus Table panel.
-
You can click the Graph tab to switch to a graph of the same data, add a panel, and pick another metrics, and so on.
This opens a dashboard screen. You have a choice of Table or Menu tabs.

If you are just looking for simple, no frills metrics panels, you might be able to use Prometheus. If you are looking for more control over the visualizations then you might use a tool like Grafana that has a Prometheus data source plugin.
Using Grafana and Prometheus Data Source Plugin to Visualize Vertica Metrics
This section explains how you can install the Grafana Prometheus data source plugin, configure the data source, and visualize and build dashboards for Vertica metrics in Grafana.
-
In the Grafana Data Sources configuration, find and install the Prometheus plugin.

-
Configure a Prometheus data source.
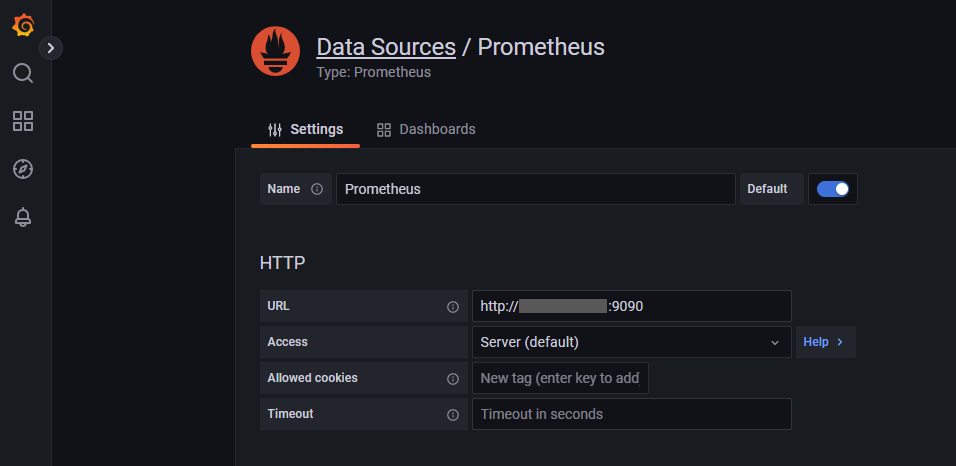
Note The Prometheus data source configuration screen has several other options. We are showing a truncated shot of it as these are the fields of interest for this exercise.
After you configure the Prometheus data source you can visualize the Vertica metrics it has captured.
-
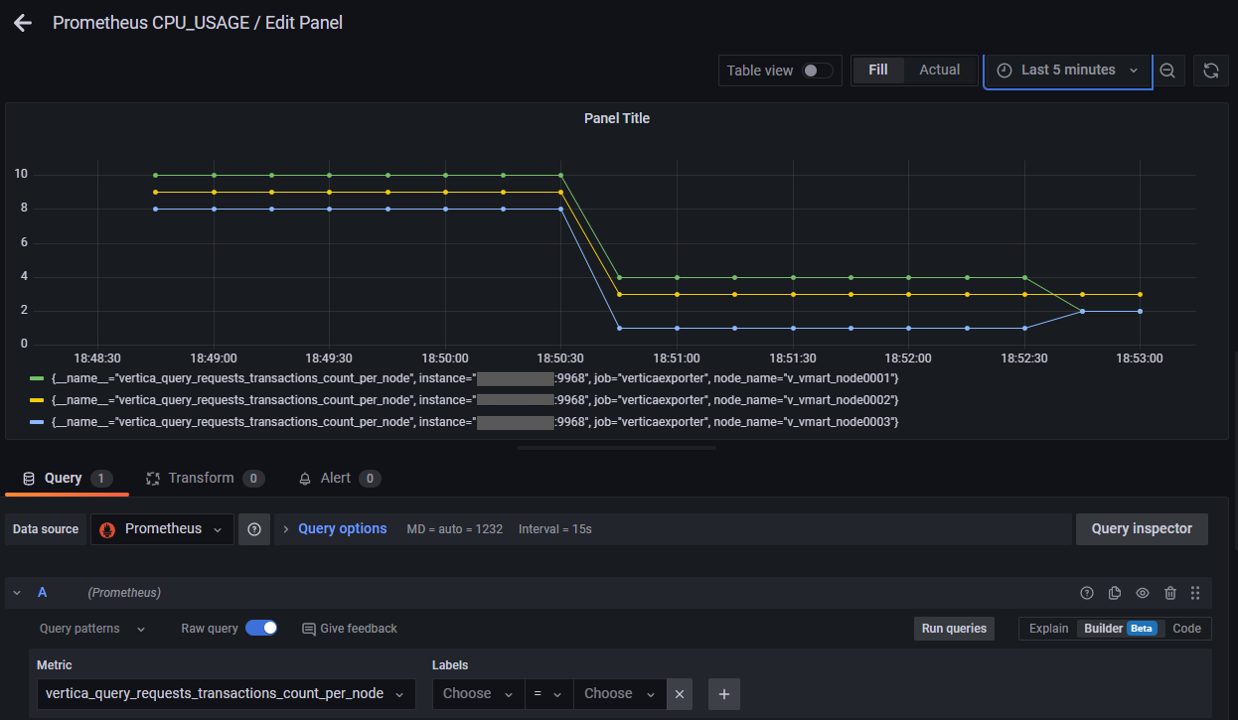
We created a new dashboard, a new panel, selected the Prometheus data source, and pulled down the list of available metrics.
-
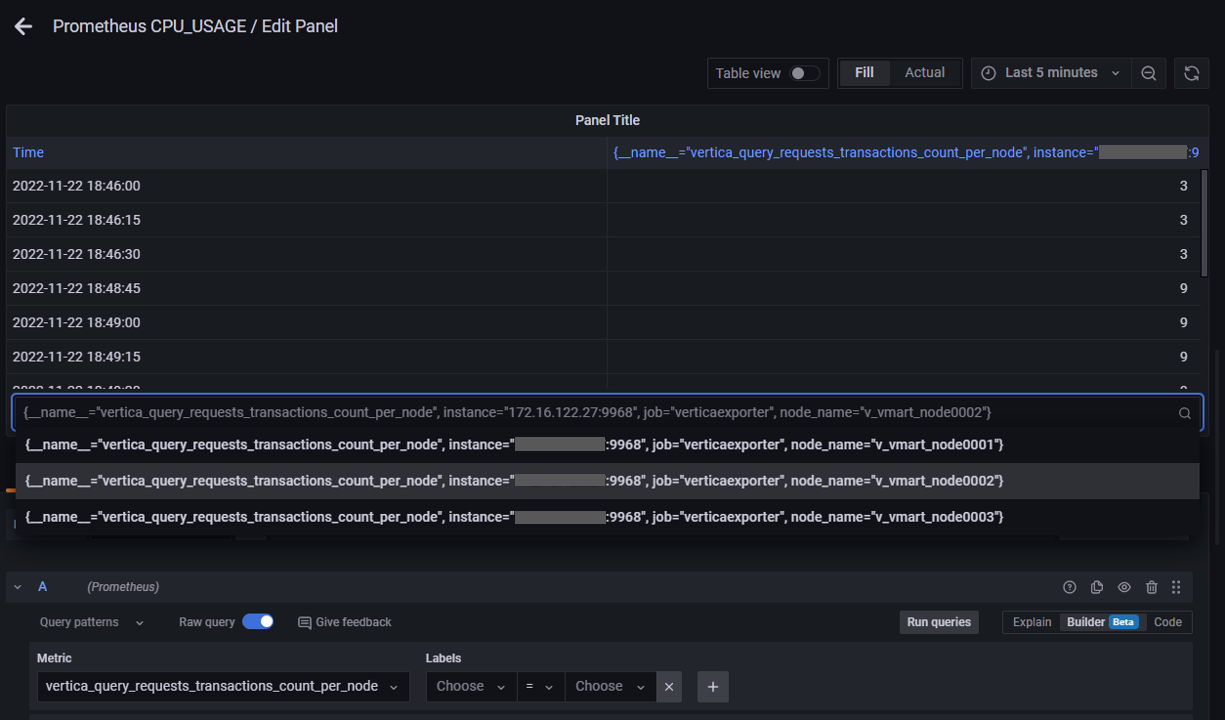
For the graph, we selected the same metric as we selected in Prometheus’ web interface, the “
vertica_query_requests_transactions_count_per_node” metric. -
Here we changed the panel type from Graph to Table. Note that the bottom of the table has a pull down to select the node you want to view.
-
Here we changed the panel type to Gauge. Note that each node gets it’s own gauge within the single panel.

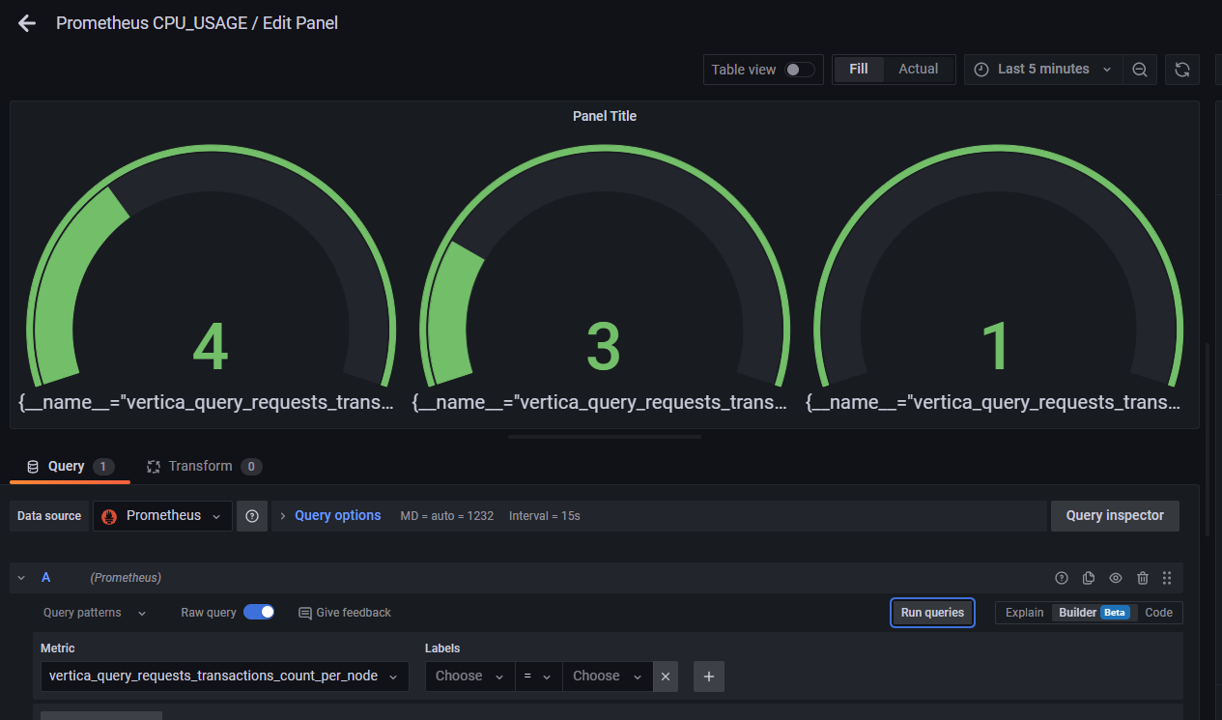
Prometheus only supports numeric values.
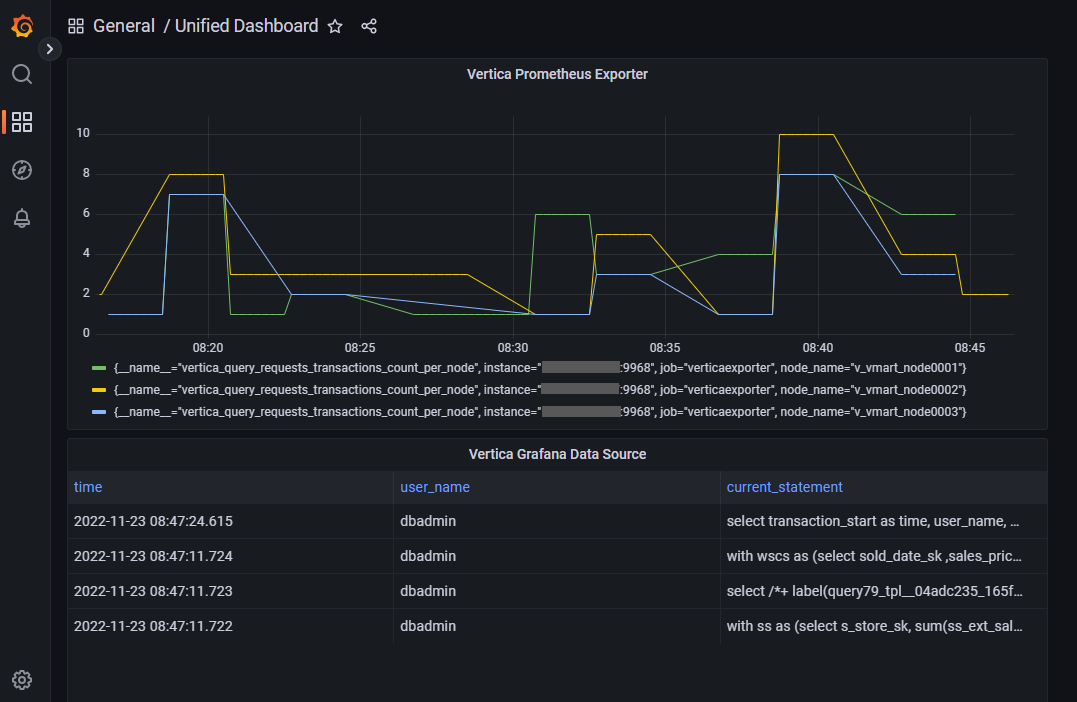
So let’s say you are tracking transaction counts using the exporter, but you want to view the transaction information itself. The Vertica Grafana data source plugin supports text values. So, in this screen we have added a panel to the dashboard that uses the Vertica Grafana Data Source that shows the most recent transactions.
This shows how the two can be used to compliment each other. Also, it illustrates the use of a unified dashboard. You can build a dashboard in Grafana that has panels coming from many different data sources.
Summarizing the Solution
In this solution document, we demonstrated the basic tech stack the exporter would live in. We explain basic steps building the stack from the exporter all the way to showing the Vertica metrics visualized in Grafana. This solution enables users to retrieve Vertica data into the widely-used Prometheus format that can then be used to visualize metrics in a communal dashboard. At each step along that path we showed what was possible for visualization.
Your tech stack might simply be the exporter and issuing CURL commands in a cron job. It might end at Prometheus using simple tables and graphs or it might be the complete stack using Grafana or a similar tool to build more complex dashboards. It is flexible enough to configure to meet your needs. As you saw, you might need to use a combination of tools to get the desired metrics.
References
vertica-prometheus-exporter (GitHub)
Prometheus - Monitoring system & Time Series Database
Grafana: The Open Observability platform | Grafana Labs
Prometheus | Grafana documentation

