


Prometheus and Vertica Prometheus Exporter: Technical Exploration
The goal of this exploration was to review the third party authored Vertica Prometheus Exporter for usability, functionality, and extendability and to provide some observations that might help others who are looking at using this Exporter with Vertica. The focus of the exploration was on the Exporter, not Prometheus, so most findings and observations are Exporter centric.
Prometheus Overview
Prometheus is an open-source time series oriented systems monitoring and alerting toolkit. Prometheus scrapes metrics from instrumented jobs. It stores all scraped data (samples) locally and provides a web interface to render the data in tabular or graph views. There are optional rules that can be run over this data to either aggregate and record new time series from the existing data or generate alerts. Grafana or other API consumers can be used to visualize the collected data.
Vertica Prometheus Exporter Overview
The Vertica Prometheus Exporter, from here on referred to as the Vertica Exporter, is an open source Vertica aware extension to Prometheus. It allows the collection of Vertica metrics and rendering in the necessary format to be scraped and processed within Prometheus. It is written in GO and uses the Vertica-sql-go driver.
Process Flow Overview
The Vertica Exporter is started and initiates a connection with Vertica. It supplies a simple http browser interface at a URL similar to this, http://<exporterserveriporname>:8080/metrics. Prometheus is started and reads it’s configuration file, which includes defined “jobs”. The job for the Vertica Exporter is defined with that url as the target address. At defined global or job level intervals Prometheus “scrapes” point in time data from the URL address, applies defined rules if any for aggregation and alerts, and stores the results in it’s internal time series database.
Scraping and evaluation continues based on the intervals defined. Prometheus provides an http browser interface as it’s default interface. Open the URL to view runtime, configuration, status info as well as tabular or graph views of the time series based data.
Test Environment
Vertica Database
Vertica 9.3.x Enterprise Mode single node
Vertica 10.0.0 EON Mode multiple node
Both had default configuration parameter values and the VMart example database loaded.
Prometheus
Prometheus 2.19.2 running on CentOS 7.4 kernel 3.10.0-514.10.2.el7.x86_64
- Tested the binary tar/gz download, did not do a go build
- Default port 9090
Vertica Exporter
Vertica Exporter 0.4 running on CentOS 7.4 kernel 3.10.0-693.11.6.el7.x86_64
- Build was done with go version go1.14.4 linux/amd64
- Default port 8080
- Tests were done with the Vertica Exporter running on the same host and on a different host from the Prometheus host and Vertica servers.
- See Update - June 2022 at the end of this document for additional version information.
Test Scope
The scope of the tests was focused on these specific areas:
- Usability of documentation for build and configuration of the Vertica Exporter
- Functionality provided out of the box
- Extendability to customize and/or extend functionality to meet needs
Note While performance was not specifically tested, some observations about potential impact to Vertica performance is included.
Test Notes
Prometheus configuration file, Prometheus.yml, had the following basic configuration for the Vertica Exporter. The only optional entry was the scrape interval which was set to a value different than the global value.
- job_name: 'vertica'
scrape_interval: 60s
static_configs:
- targets: ['nn.nn.nn.nn:8080']
Both Prometheus and Vertica Exporter processes were run with nohup and “&” so they would run in background and not terminate on exit of the putty session to the host(s). In configurations where both ran on the same host, they were run in different directories so each had a unique nohup.out for ease of review and debug.
Vertica Exporter was set up to test the following configurations:
- Prometheus, Vertica Exporter, and Vertica database on the same host.
- Prometheus and Vertica Exporter on the same host with Vertica database on a different host or hosts.
- Prometheus, Vertica Exporter, and Vertica database all on different hosts.
All tests were run in a controlled environment with no other clients or processes running on or against the Vertica databases.
Tests were run several times to confirm there were no major deviations in responsiveness, reliability, or results over time.
All results in Prometheus were compared to their respective Vertica queries to make sure that the Vertica Exporter capture of the default metrics and collection by Prometheus worked correctly.
Details of Tests and Results
Vertica Exporter was tested standalone using it’s built in URL to ensure that it was connecting to Vertica, successfully executing the system table queries it was using to get metrics, and rendering the results in a format Prometheus could scrape.
Vertica system tables and vertica.log file were reviewed to determine the Vertica Exporter connection is a one-time connection at first start of it’s browser page. The driver and driver version were reviewed to ensure latest was being used. See Troubleshooting for an issue in an older release of the Vertica Exporter.
dbadmin=> select user_name,client_hostname,client_type,client_version from sessions;
user_name | client_hostname | client_type | client_version
-----------+--------------------+----------------+----------------
dbadmin | [::1]:59844 | vsql | 09.03.0000
dbadmin | 10.20.43.234:53824 | vertica-sql-go | 1.1.0
Page refreshes triggered the queries to execute and new values to be reported. Note that the Vertica Exporter’s results are a non persistent snapshot in time. They are raw real-time results that are not stored.
Prometheus’ Prometheus.yml file was configured with a “vertica” job that allowed it to scrape data from the Vertica Exporter. Testing was done to verify scraping was occurring at the configured scrape interval, and the results of the scrape were being recorded correctly by Prometheus. Also, the time series built up over several intervals was as expected.
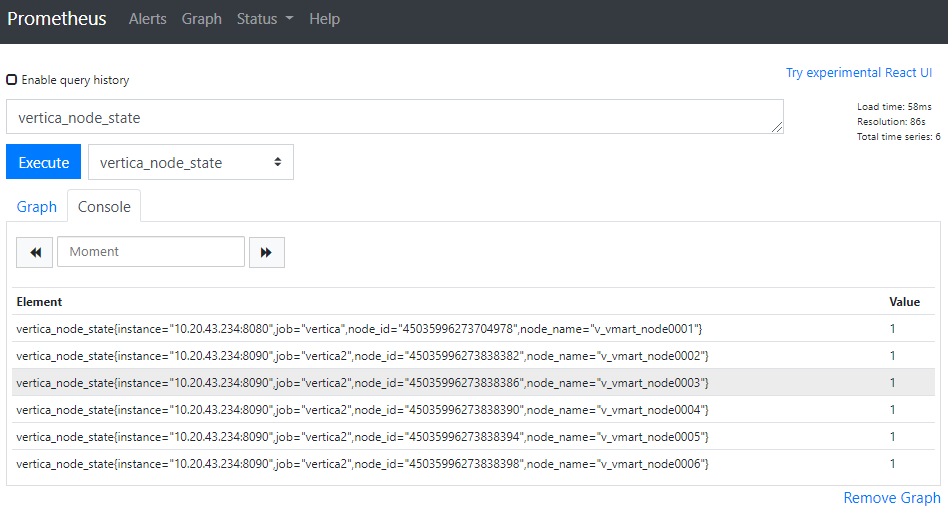
Two Vertica Exporters were run on the same host pointing to different Vertica databases and using different listening ports. Prometheus was reconfigured to add the vertica2 job pointing to the second Vertica Exporter listening port. It successfully reported metrics from both databases, proving that multiple Vertica Exporters can be run to allow monitoring of multiple databases.
We extended the Vertica Exporter monitoring package metrics and confirmed in the Vertica Exporter web interface that the new data appeared. Note this was purposefully a user defined table vs system table, to prove that you could also monitor that type of data in the Prometheus using the Vertica Exporter.
# table definition
dbadmin=> \d stocks
List of Fields by Tables
Schema | Table | Column | Type | Size | Default | Not Null | Primary Key | Foreign Key
--------+--------+---------------+------------+------+---------+----------+-------------+-------------
public | stocks | ticker_name | varchar(4) | 4 | | f | f |
public | stocks | shares_traded | int | 8 | | f | f |
public | stocks | share_value | int | 8 | | f | f |
public | stocks | date_sold | timestamp | 8 | | f | f |
dbadmin=> select * from stocks order by date_sold;
ticker_name | shares_traded | share_value | date_sold
-------------+---------------+-------------+---------------------
ABCD | 150 | 38 | 2020-08-19 12:00:00
# Added a .go file in the Vertica Exporter monitoring directory with the following code
[dbadmin@eco-g9-001 monitoring]$ cat stocks.go
package monitoring
import (
"fmt"
"log"
"github.com/jmoiron/sqlx"
)
// QueryRequest3 lists query performance metrics on the username level.
type QueryRequest3 struct {TickerName string `db:"ticker_name"`
SharesTraded int `db:"shares_traded"`
ShareValue int `db:"share_value"`
}
// NewQueryRequests3 returns query performance for all users.
func NewQueryRequests3(db *sqlx.DB) []QueryRequest3 {sql := `
select ticker_name,shares_traded,share_value from stocks order by date_sold desc;
`
queryRequests3 := []QueryRequest3{}err := db.Select(&queryRequests3, sql)
if err != nil {log.Fatal(err)
}
return queryRequests3
}
// ToMetric converts QueryRequest3 to a Map.
func (qr QueryRequest3) ToMetric() map[string]int {metrics := map[string]int{}tickername := fmt.Sprintf("ticker_name=%q", qr.TickerName)metrics[fmt.Sprintf("vertica_shares_traded{%s}", tickername)] = qr.SharesTradedmetrics[fmt.Sprintf("vertica_share_value{%s}", tickername)] = qr.ShareValuereturn metrics
}
# added entry to the Vertica Exporter prometheus.go
for _, queryRequest3 := range NewQueryRequests3(&db) {metrics = append(metrics, queryRequest3)
}
# Rebuilt the exporter using “go build”
# Start the Vertica Exporter
[dbadmin@eco-g9-001 vertica-prometheus-exporter-master]$ ./vertica-prometheus-exporter -db_name VMart -db_user dbadmin -db_password dbpasswd -db_host nn.nn.nn.nnn
INFO[0000] starting serving metrics at 0.0.0.0:8080/metrics
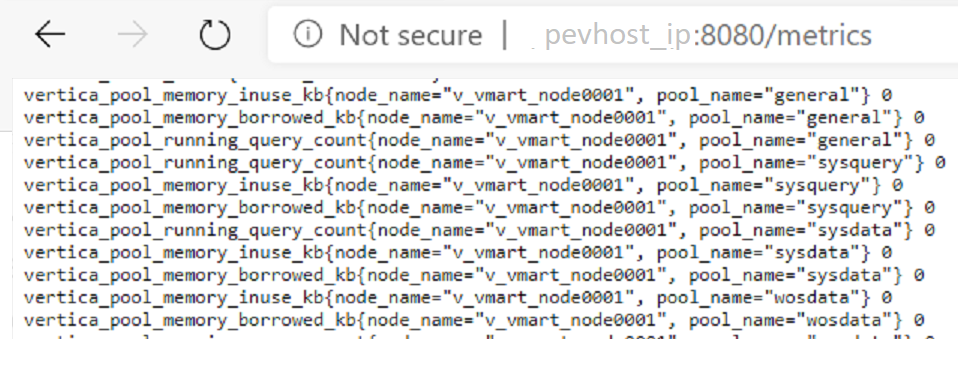
# Open the web page on 8080 and check for new metrics
...
vertica_shares_traded{ticker_name="ABCD"} 150vertica_share_value{ticker_name="ABCD"} 38vertica_pool_memory_inuse_kb{node_name="v_vmart_node0001", pool_name="general"} 0vertica_pool_memory_borrowed_kb{node_name="v_vmart_node0001", pool_name="general"} 0...
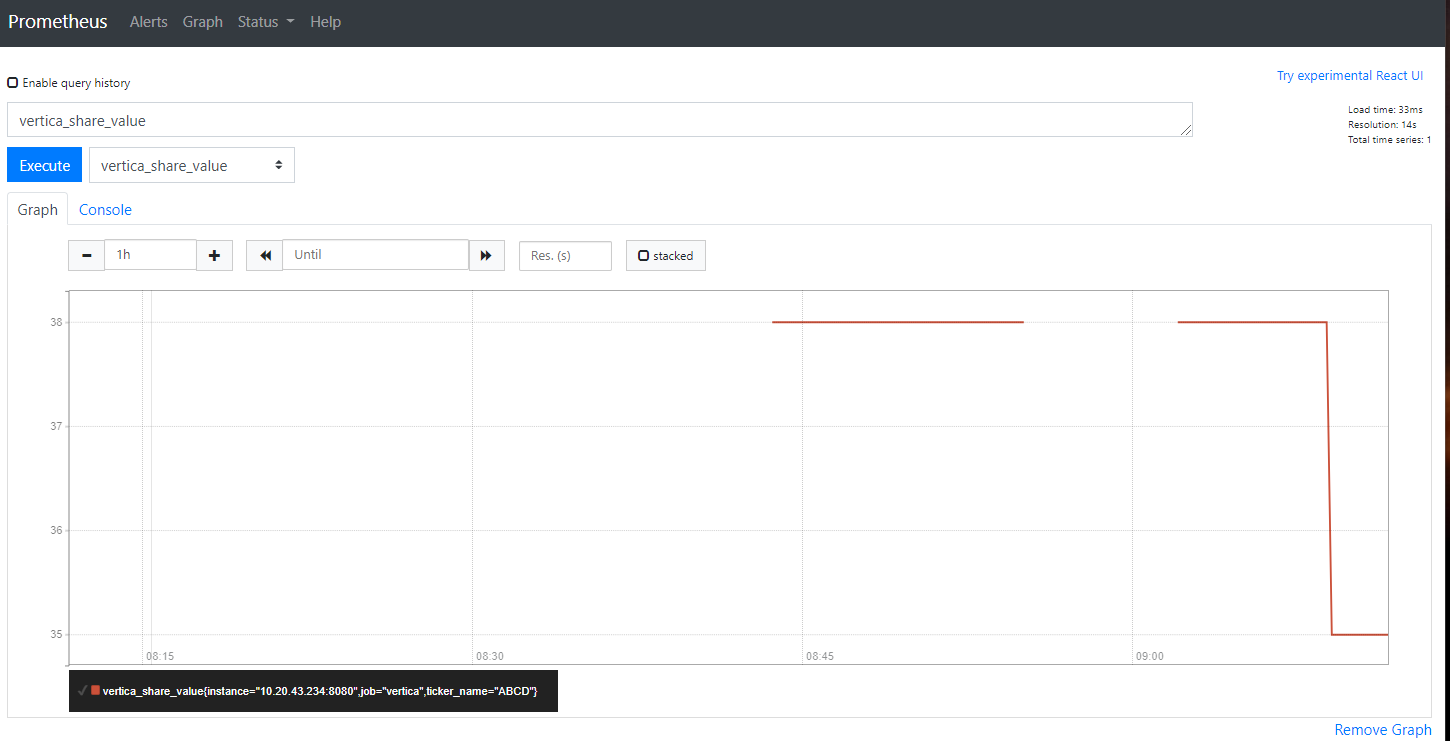
# insert record in Vertica and verify shows up in Prometheus
dbadmin=> insert into stocks values('ABCD','150','35','2020-08-19 12:10:00');OUTPUT
--------
1
Observations
Overall a relatively easy to use customizable and extendible addition to Prometheus making it Vertica aware and allow reporting metrics in simple table or graph views.
Usability of documentation for build and configuration of the Vertica Exporter
The README.md that comes with the Vertica Exporter is adequate to get you started with the binary file. Some knowledge of setting up a GO environment is required if you want to install the master and customize or extend the exporter.
Functionality provided out of the box
The Vertica Exporter comes with some specific Vertica system table metrics focusing on node states, memory usage, resource pool usage, and a handful of system table details like ROS rows and size. There is some value to the out of the box metrics, but nothing that can’t be had via vsql, Management Console, or any SQL Client that connects to Vertica. The value is in being able to monitor multiple Vertica databases along side any other metrics collected using other exporters.
Where the Vertica Exporter connects and doesn’t disconnect, this prevents use of the Vertica native load balancer and backup server features. See additional comments below in the Extendability section.
Extendability to customize and/or extend functionality to meet needs
Very customizable as both Prometheus and the Vertica Exporter are open source GO based applications. So for either, you can modify the source to meet your needs and rebuild.
The Vertica Prometheus Exporter supplies some metrics based on a few different system tables. By adding more metric .go files to the Master /monitoring directory, updating the Prometheus.go, and rebuilding you can collect more metrics of your choice. Our tests proved that you can capture not only system table metrics but also metrics against user defined tables.
Additional Observations
Prometheus uses it’s own built in time series database to store the collected data, so you need to make sure to have available disk space enough to meet needs of data collected over time. This can vary based on number of metrics you export and frequency of scraping.
The Vertica Exporter opens a connection to the Vertica database on process start and keeps it open. If that node goes down you’ll need to kill the Vertica Exporter process and restart it pointing to an alternate host in the Vertica cluster using the –db_host argument.
Because of the persistent single connection noted above, the Vertica native load balancing and backup server features are unsupported in the out of the box Vertica Exporter. To support them, you would have to customize the Vertica Exporter source to periodically disconnect/reconnect, and to accept the load balancing and backup server connection properties in the arguments passed to the connect string.
If there is a new version of vertica-sql-go and you want to incorporate it prior to the author updating the master and binary, then you need to install the master, update the driver, and rebuild the exporter.
The exporter doesn't present anything that isn't available using vsql, Management Console, or Grafana plug-in. The major benefits are being able to retain metrics in a time series format and the ability to monitor several disparate systems in one tool using multiple exporters within Prometheus.
Troubleshooting
This problem and solution only apply to Vertica Prometheus Exporter versions 0.4 or older. We ran into some ParameterStatus warning messages in the Vertica Exporter console.log as shown below.
[dbadmin@eco-g9-001 vertica-prometheus-exporter-master]$ ./vertica-prometheus-exporter -db_name VMart -db_user dbadmin -db_password vert1caBdp -db_host 172.16.116.21
INFO[0000] starting serving metrics at 0.0.0.0:8080/metrics
Aug 19 10:05:42.388036 WARN connection: unhandled message: ParameterStatus: standard_conforming_strings='on'
Aug 19 10:05:42.388204 WARN connection: unhandled message: ParameterStatus: MARS='off'
Aug 19 10:05:42.388227 WARN connection: unhandled message: ParameterStatus: client_locale='en_US@collation=binary'
Aug 19 10:05:48.527897 WARN connection: unhandled message: ParameterStatus: standard_conforming_strings='on'
Aug 19 10:05:48.527926 WARN connection: unhandled message: ParameterStatus: MARS='off'
Aug 19 10:05:48.527949 WARN connection: unhandled message: ParameterStatus: client_locale='en_US@collation=binary'
Aug 19 10:05:48.628819 WARN connection: unhandled message: ParameterStatus: standard_conforming_strings='on'
Aug 19 10:05:48.628845 WARN connection: unhandled message: ParameterStatus: MARS='off'
Aug 19 10:05:48.628868 WARN connection: unhandled message: ParameterStatus: client_locale='en_US@collation=binary'
There is a pull request for the vertica-sql-go driver related to this which was fixed in the 1.0.0 release.
https://github.com/vertica/vertica-sql-go/pull/74
Based on the output of a query against the Vertica vsql sessions system table, it was determined that the Vertica Exporter was using an older version 0.2 of the driver. So we pulled down the Vertica Exporter master, expanded it, and then ran:
go get -u github.com/vertica/vertica-sql-go
go build
Restarted the Vertica Exporter process and confirmed the new driver was in use and no more WARN messages in the console.
dbadmin=> select user_name,client_hostname,client_type,client_version from sessions;
user_name | client_hostname | client_type | client_version
-----------+--------------------+----------------+----------------
dbadmin | [::1]:59844 | vsql | 09.03.0000
dbadmin | 10.20.43.234:53824 | vertica-sql-go | 1.1.0
Note This was in the 0.4 release of Vertica Prometheus Exporter. The author updated the vertica-sql-go driver a day after we reported it. The recent 0.5 release includes the vertica.sql-go 1.1.0 driver.
Recommendations
Based on our testing here’s a shortlist of recommendations for the Vertica Prometheus Exporter.
Set the exporter scrape and evaluate intervals to something that minimizes the impact to Vertica while giving you the granularity in the results you desire. Try to keep the number of metrics and duration to process them to something reasonable. Possibly do some timing of those queries during peak hours and make sure your scrape intervals are set to a value longer than the queries take to run.
There are some system tables known to be poor performers, which can add significant time to the scrapes. The storage_containers and delete_vectors are particularly resource intensive. Again, time your queries before implementing into the exporter.
Prometheus defaults to port 9090 and the Exporter defaults to port 8080. Make sure these ports are available and not blocked by the firewall. Prometheus has a github available port site for exporter developers to reserve a port above 9100 but the author of the Vertica Exporter chose to use a default port outside that range.
Update - June 2022
The initial testing of Prometheus with Vertica was an exploration to see how feasible a solution this exporter was. Since the testing with exporter .4 and Prometheus 2.19 a few newer releases of each have come out, but there aren’t any changes that impact the exporter’s functionality.
Vertica is working on a project to create its own Prometheus exporter that will be released as open source on Github. So no further testing of this exporter will be done. The new Vertica exporter will be tested with the latest release of Prometheus to ensure compatibility.
For More Information
Prometheus on GitHub - Open source distribution of Prometheus
Vertica Prometheus Exporter on GitHub - Open source distribution of the exporter
Prometheus Exporter Port List Site - To check for in use ports by other exporters

