


Node Recovery in Vertica
In the Vertica database, a node in the DOWN state does not participate in any transactions committed since the time the node went down. After restarting the DOWN node, that node must recover the data it missed from the buddy nodes before moving to the UP state. When the node is in the UP state, it is fully recovered and ready to process all database transactions.
This document is intended for advanced Vertica users and assumes that you have experience recovering nodes. The purpose of this document is to provide insight about:
- Vertica 9.1.x node recovery process
- Tools to monitor the recovery of a node
- Troubleshooting tips to diagnose and resolve node recovery issues
Node Recovery Process
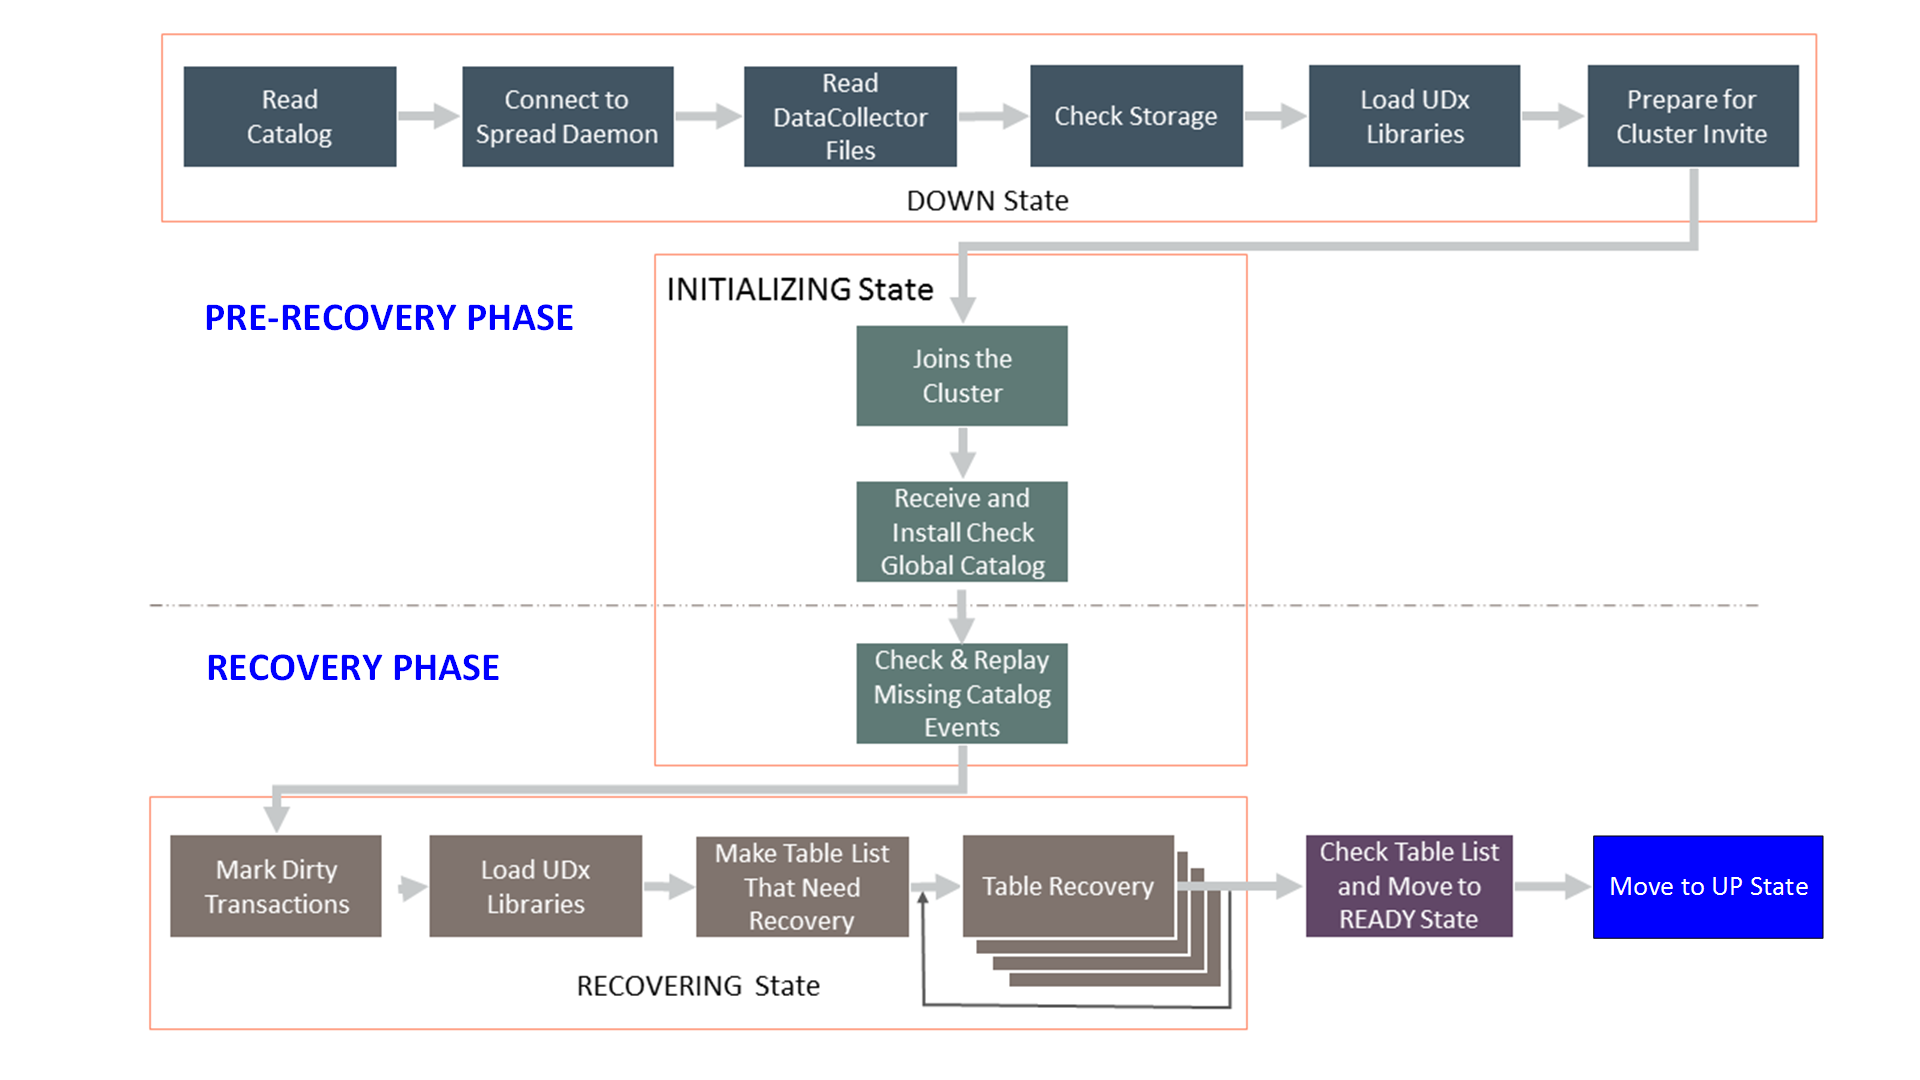
Vertica performs node recovery in two phases:
- Pre-recovery phase: In this phase, the recovering node performs the following tasks:
- Restarts spread daemon
- Reads its catalog on disk
- Validates data storage
- Joins the cluster
- Recovery phase: In this phase, the recovering node:
- Receives new data loaded into the cluster
- Recovers data that it missed when the node was in DOWN state before moving to the UP state
If a database node is in the RECOVERING state, Tuple Mover can perform moveout and mergeout operations as needed during the recovery. Tuple Mover performs mergeout during recovery, merging ROS containers and preventing ROS pushback. In addition, Tuple Mover performs moveout, moving data from the WOS to the ROS. Doing so allows tasks like trickle-loading to take place during recovery, creating a sustainable load process that generates fewer ROS containers. Both mergeout and moveout can improve the performance of your node recovery.
The following image gives a detailed workflow that shows all the stages of the node recovery process:
Pre-Recovery Phase
The pre-recovery phase starts immediately after the node restarts and runs until the node rejoins the cluster. To track the node progress during this phase, use the startup.log file located in the catalog directory. The startup.log file is a subset of the vertica.log file.
The pre-recovery phase has following stages:
| Stages | Description |
|---|---|
|
Reads the catalog |
The recovering node reads the catalog checkpoints, applies the transaction logs, and indexes the catalog objects. |
|
Starts and connects to the spread deamon |
Vertica starts the spread daemon on the recovering node and connects to spread daemon. However, if your database runs in large cluster mode, a subset of nodes known as control nodes run the spread daemon instead. |
|
Reads the DataCollector files |
The recovering node creates an inventory of the DataCollector files. |
|
Checks data storage |
|
|
Loads UDx libraries |
The recovering node loads the User Defined Extension (UDx) libraries. |
|
Prepares for Cluster Invite |
The recovering node joins the spread group and broadcasts messages to the other nodes. The recovering node waits for an invitation from the other nodes to rejoin the cluster. |
|
Joins the cluster |
Upon invitation, the node joins the cluster and the node state changes to the INITIALIZING state. |
|
Receives and install the new global catalog |
The recovering node shares the catalog version with other nodes in the cluster. If the catalog version of the recovering nodes is lower than the nodes in the UP state, a node in the UP state sends the global catalog to the recovering node in the chunks of 1 GB. The recovering node installs the new catalog received from one of the UP nodes. |
Recovery Phase
In the recovery phase, the recovering node receives new data loaded in the database. The recovering node also recovers data that it missed while in the DOWN state until this point from the recovering node’s buddy nodes.
You can track the progress of this phase using the following system tables:
- TABLE_RECOVERY_STATUS
- TABLE_RECOVERIES
- PROJECTION_RECOVERIES
The recovery phase has following stages:
| Stage | Description |
|---|---|
|
Checks and replays missing catalog events |
The recovering node checks for missing events and replays the missed events in the order in which they were committed. The Vertica catalog has a log of the following types of catalog events, the tables involved, and the epochs in which the events were committed.
|
|
Marks dirty transactions |
Dirty transactions are uncommitted transactions that start before the beginning of the RECOVERY phase. During recovery, Vertica marks the dirty transactions, and the state of the recovering node state changes from INITIALIZING to RECOVERING. The node in RECOVERING state participates in all data load plans. |
|
Loads UDx libraries |
The recovering node loads the UDx libraries received from the nodes in the UP state. |
|
Makes list of tables that need recovery |
The recovering node makes a list of tables that need recovery. |
|
Table Recovery |
For step-by-step details about table recovery, see Steps for Table Recovery. As of Vertica 7.2.2, Vertica recovers more than one table concurrently. The number of tables that Vertica can recovery concurrently depends on:
As of Vertica 7.2.x, you can specify the order of table recovery. For more information, see Prioritizing Table Recovery in Vertica documentation. |
|
Check table list and move to READY state
|
If the list of tables that need recovery is now empty, Vertica changes the node state from RECOVERING to READY. If the list is not empty, Vertica retries the steps for recovery up to 20 times. If these repeated attempts fail, node recovery fails and the node state changes to DOWN. |
|
Move to UP state |
In the final step of the recovery phase, Vertica changes the state of the node from READY to UP. From this point, the recovering node accepts new connections and participates in all database plans. |
Steps for Table Recovery
- Replay catalog events: The recovering node replays catalog events that the recovering table missed while the node was in DOWN state. The recovering node checks the following catalog events for the recovering table:
- Truncate table
- Add column
- Rebalance table
- Alter partition
- Drop partition
- Restore table
- Move partition
- Swap partition
- Database rollback
- Replace node
- Merge projection
- Historical recovery phase: For each projection, Vertica retains the Checkpoint Epoch for each node. The Checkpoint Epoch represents a point in time up to which all the data was stored on disk.
The projections anchored on the recovering table recover the historical data that the table missed. During this stage, Vertica recovers data from projection Checkpoint Epoch to the Current Epoch. There are three methods for data recovery.
If the Checkpoint Epoch of the projection is 0, the node recovers the projection data using the recovery-by-container method. In the recovery-by-container method, the recovering node copies the storage containers and delete vectors from the buddy nodes. If the Checkpoint Epoch of the projection is not 0, Vertica uses the incremental method to recover the projection data. With the incremental method, Vertica first scans the storage containers of the buddy projection to fetch the needed projection data. Then, the projection data are sorted on demand and written to disk on the recovering node. The incremental method only recovers storage containers. Hence, if there are any delete vectors committed when the recovering node is down, an incremental-replay-delete method is used to recover the delete vectors by following the incremental method. Vertica does not acquire any locks in the historical recovery stage.
- Recover dirty transactions phase: Use the
RecoveryDirtyTxnWaitconfiguration parameter to control the amount of time the recovering node waits for the dirty transactions to be committed.- Sometimes the recovering node finds uncommitted dirty transactions. In such cases, by default the node waits five minutes for those transactions to be committed. After five minutes, the Vertica recovery process terminates all the uncommitted dirty transactions.
- After the dirty transactions commit, the recovering node will recover the data loaded through dirty transactions. Vertica can use the incremental and incremental-replay-delete methods for data recovery in this phase. No lock is acquired at the dirty transaction phase.
- Replay delete phase: Deletes could occur during node recovery, and steps 2 and 3 do not take locks. However, delete operations started after the node enters the RECOVERING state do not create delete vectors on the recovering node. Vertica recovers those missed delete vectors in the replay delete phase. At this stage, Vertica takes a T-lock on the recovering tables and uses the incremental-replay-delete method to recover the missed delete vectors. At this stage, the recovering node also determines if the tables have any discrepancies in the catalog events from the last replay of catalog events. If the recovering node finds a missed event, the recovery for this table fails and table is marked as "Failed to recover". Then, the recovering node will retry the entire table recovery process from step 1 on the failing tables. Vertica allows a maximum of 20 recovery attempts before failing the node recovery.
- Finish Table Recovery: Upon successful completion of the above steps, Vertica marks the table as recovered and moves the table off the list of tables that need to be recovered. From this point, the recovered table participates in all DDL and DML plans.
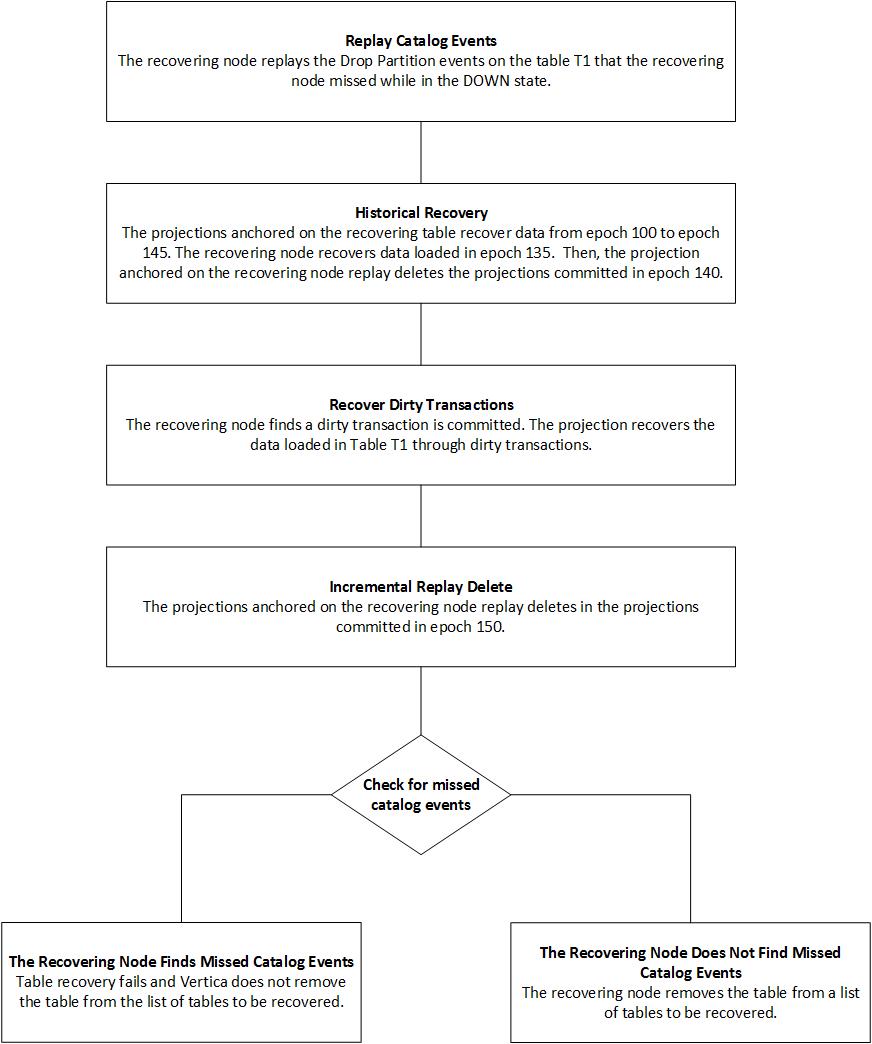
Table Recovery Example
Scenario: You have a 6 node cluster with table T1. Node 5 goes down at epoch 100. The Checkpoint Epoch of projections anchored on the table T1 was 99 on node 5.
Assumption: Vertica performed the following transactions on the table T1 when the node 5 was in DOWN state.
- Dropped partition of Table T1 at epoch 125
- Data loaded in Table T1 at epoch 135
- Data deleted from Table T1 at epoch 140
Vertica restarted the node 5 and the changed the state of the node to RECOVERING at epoch 145. Vertica recorded a dirty transaction loading data in Table T1 at the point when the node moved to the RECOVERING state. During the dirty transaction recovery phase, data is deleted from Table T1 at epoch 150.
The following image provides detailed information for different steps of table recovery:
Monitoring Node Recovery
When you have a node in the DOWN state, to monitor the recovery process, follow these steps:
- Identify the state of the recovering node by running the following command:
$ /opt/vertica/bin/admintools -t view_cluster
     DB    |     Host     |   State
-----------+--------------+------------
mydatabase | 112.17.31.10 | UP
mydatabase | 112.17.31.11 | UP
mydatabase | 112.17.31.12 | INITIALIZING
mydatabase | 112.17.31.17 | UP
__________________________________________________
- If the node state is DOWN or INITIALIZING, monitor the progress of the recovering node using
tail startup.log:$ tail catalog-path/database-name/v_database-name_node_catalog/startup.log
During the node recovery, Vertica updates the recovering node's startup.log. These updates are in the form of JSON information blocks that show the following:
{
"goal" : 477688606,
"node" : "v_newdb2_node0003",
"progress" : 146732903,
"stage" : "Read DataCollector",
"text" : "Inventory files (bytes)",
"timestamp" : "2016-03-16 17:28:32.016"
			}
Note that the recovery status about a node in the system tables TABLE_RECOVERY_STATUS, TABLE_RECOVERIES, and PROJECTION_RECOVERIES is not available when the state of that node is DOWN or INITIALIZING.
- When the node state is RECOVERING, track the progress of the node using system tables:
To view the summarized status, run the following query:
=> SELECT * FROM TABLE_RECOVERY_STATUS;
To view tables and projections recovery details, run the following queries:
=> SELECT * FROM TABLE_RECOVERIES;
=> SELECT * FROM PROJECTION_RECOVERIES;
For example, if the recovery-by-container method is used, you are expected to see the following content in the recovery system tables during the historical recovery phase. The details about the recovery phase and recovery methods are shown in the system tables TABLE_RECOVERIES and PROJECTION_RECOVERIES, respectively.
=> SELECT * FROM TABLE_RECOVERIES;
node_name | table_oid | table_name | status | phase | thread_id | start_time |
end_time | recover_priority | recover_error | is_historical
-----------+-------------------+------------+------------+------------+-------
node02 | 45035996273819958 | public.t1 | recovering | historical | 7f3abf7fe700
| 2018-04-22 21:41:25.134359-04 | | -9223372036854775807 | | f
(1 row)
=> SELECT * FROM PROJECTION_RECOVERIES;
node_name | projection_id | projection_name | transaction_id | statement_id |
method | status | progress | detail | start_time | end_time | runtime_priority
-----------+-------------------+-----------------+-------------------+---------
node02 | 45035996273820032 | public.t1_b0 | 49539595901075518 | 1 | recovery-by-container
| finished | | | 2018-04-22 21:41:25.146027-04 | 2018-04-22 21:41:25.166691-04 |
node02 | 45035996273820042 | public.t1_b1 | 49539595901075517 | 1 | recovery-by-container
| running | | CopyStorage:0/0 | 2018-04-22 21:41:25.145689-04 | |
(2 rows)
If the recovery adopts the incremental method, the system table PROJECTION_RECOVERIES will show the following content:
=>SELECT * FROM PROJECTION_RECOVERIES;
node_name | projection_id | projection_name | transaction_id | statement_id |
method | status | progress | detail | start_time | end_time | runtime_priority
-----------+-------------------+-----------------+-------------------+--------
node02 | 45035996273824238 | public.t1_b1 | 49539595901075634 | 1 | incremental
| running | 0 | Scan:0% Sort:0% Write:0% | 2018-04-22 21:42:07.151166-04 | |
node02 | 45035996273824228 | public.t1_b0 | 49539595901075633 | 1 | incremental
| running | 0 | Scan:0% Sort:0% Write:0% | 2018-04-22 21:42:07.151473-04 | |
(2 rows)
When the incremental-replay-delete is applied, the system table PROJECTION_RECOVERIES can provide the following details:
=>SELECT * FROM PROJECTION_RECOVERIES;
node_name | projection_id | projection_name | transaction_id | statement_id |
method | status | progress | detail | start_time | end_time | runtime_priority
-----------+-------------------+-----------------+-------------------+--------
node02 | 45035996273824238 | public.t1_b1 | 49539595901075634 | 1 | incremental-replay-delete
| finished | | | 2018-04-22 21:42:07.151166-04 | 2018-04-22 21:42:11.976041-04 |
node02 | 45035996273824228 | public.t1_b0 | 49539595901075633 | 1 | incremental-replay-delete
| running | 46 | Delete:0/4 | 2018-04-22 21:42:07.151473-04 | |
(2 rows)
When node recovery enters the dirty transaction recovery phase, the system table TABLE_RECOVERIES will capture the changes in the phase column:
=>=> SELECT * FROM TABLE_RECOVERIES;
node_name | table_oid | table_name | status | phase | thread_id | start_time |
end_time | recover_priority | recover_error | is_historical
-----------+-------------------+------------+------------+------------------+-
node02 | 45035996273825192 | public.t1 | recovering | historical dirty | 7f159f7fe700
| 2018-04-25 15:46:13.096937-04 | | -9223372036854775807 | | f
node02 | 45035996273825196 | public.t2 | recovered | | 7f16037fe700 | | 2018-04-25
15:46:13.09384-04 | -9223372036854775807 | |
(2 rows)
When node recovery enters the replay delete stage, you are expected to see the phase column become the current replay delete in the TABLE_RECOVERIES system table:
=>SELECT * FROM TABLE_RECOVERIES;
node_name | table_oid | table_name | status | phase | thread_id | start_time |
end_time | recover_priority | recover_error | is_historical
-----------+-------------------+------------+------------+------------------+-
node02 | 45035996273826218 | public.t1 | recovering | current replay delete |
7f60faffd700 | 2018-04-25 15:46:38.130421-04 | | -9223372036854775807 | | f
(1 row)

=> SELECT * FROM PROJECTION_RECOVERIES;
node_name | projection_id | projection_name | transaction_id | statement_id |
method | status | progress | detail | start_time | end_time | runtime_priority
-----------+-------------------+-----------------+-------------------+--------
node02 | 45035996273826230 | public.t1_b1 | 0 | | | queued | | | | |
node02 | 45035996273826230 | public.t1_b1 | 49539595901075718 | 1 | incremental
| finished | | | 2018-04-25 15:46:38.142405-04 | 2018-04-25 15:46:38.168844-04 |
node02 | 45035996273826220 | public.t1_b0 | 49539595901075719 | 1 | incremental
| finished | | | 2018-04-25 15:46:38.142025-04 | 2018-04-25 15:46:38.168814-04 |
node02 | 45035996273826220 | public.t1_b0 | 49539595901075725 | 2 | incremental-replay-delete
| running | 20 | Delete:0/4 | 2018-04-25 15:46:38.285413-04 | |
(4 rows)
- Recovery failures occur in some cases. Four common causes of recovery failure can be failure to acquire a T-lock at the replay delete stage due to concurrent DML or DDL, failure to stop dirty transactions, failure to apply catalog events, and detection of missed catalog events. If the node state is RECOVERING or UP, there are two ways to check recovery failures on the recovering nodes. One is to check the recover_error column in the TABLE_RECOVERIES system table. For example, failure to apply catalog events can show in TABLE_RECOVERIES as follows:
=>SELECT * FROM TABLE_RECOVERIES;
node_name | table_oid | table_name | status | phase | thread_id | start_time |
end_time | recover_priority | recover_error | is_historical
-----------+-------------------+------------+------------+------------------+-
node04 | 45035996273845482 | public.t2 | error-retry | | 7f3551ffb700 | 2018-02-21 10:40:17.887369-05
| 2018-02-21 10:57:52.290204-05 | -9223372036854775807 | Event apply failed | t
node04 | 45035996273845460 | public.t1 | error-retry | | 7f35517fa700 | 2018-02-21 10:40:17.887322-05
| 2018-02-21 10:57:52.801538-05 | -9223372036854775807 | Event apply failed | t
					(2 rows)
Another way to check for recovery failures and retry attempts of recovering nodes is to run the grep command with the following keywords in the vertica.log file:
$ grep “incrCatchUpFailureCount” vertica.log
Troubleshooting Node Recovery
The following list describes the most common troubleshooting use cases and recommendations for resolving the issues:
- Symptom: Spread daemon fails to start and connect to Vertica.
Description: If the spread daemon failed to start, the node recovery fails and the recovering node continues to remain in the DOWN state.
Action: To identify the problem use thestartup.logfile or thevertica.logfile of the recovering node. Some possible resolutions are as follows:
- Verify that the
spread.conffile in the catalog directory of the recovering node is identical to allspread.conffiles on the other nodes in the cluster. - Verify that the IP address of the recovering node is appropriate in the
spread.conffile in the catalog directory. - Remove the file
4803from the temporary (/tmp) directory and restart the node.
- Symptom: The recovering node spends an unusually long time in the “check data storage” stage of the pre-recovery phase.
Description: The recovering node can spend an unusually long time in the pre-recovery phase if:
- The catalog is large in size and has millions of ROS files.
- The recovering node has to remove large number of ROS files that are not referenced by the catalog.
Action: To monitor the progress of the recovery node, use thestartup.logfile.
- Symptom: The recovering node fails with an error.
Description: The error message reads “Data consistency problems found; startup aborted”.
Action: To resolve this problem, restart the node fromadmintoolsCLI with the--forceflag:$ /opt/vertica/bin/admintools -t restart_node -d <database_name> --hosts <ip address> --force
- Symptom: The recovering node is waiting for an invitation to join the cluster.
Description: The recovering node cannot communicate with other nodes in the cluster and is waiting for an invitation from other nodes to join the cluster in the following situations:
- The firewall is enabled or the port is blocked.
- The recovering node belongs to different subnet.
Action: To resolve these issues, perform the following tasks:
- Verify the communication with other nodes in the cluster using the
netcat [$ nc] - If the recovering node belongs to a different subnet than the other nodes in the cluster, configure spread in a point-to-point mode.
- Symptom: The table recovery fails multiple times because of catalog events.
Description: Performing catalog events such as TRUNCATE TABLE or DROP PARTITION on a currently recovering table may result in table recovery failure.
If the table fails to recover after 20 attempts, Vertica recovery fails. Multiple failed recovery attempts can delay node recovery.
Action: To resolve this issue, perform the following tasks:
- To track the recovery attempts, use the following command:
$ grep “incrCatchUpFailureCount” vertica.log
For example, the following message suggests, Vertica made 17 attempts to recover the node.
[Recover] <INFO> incrCatchUpFailureCount: 17 failures, max 20
- If you notice multiple retry attempts from the above step, stop the ETL processes that aggressively performs catalog events.
- Symptom: The UPDATE and DELETE statements run for an unusually longer time.
Description: If the recovering node cannot acquire T lock on the recovering table for more than five minutes, the table recovery fails. Five minutes is a default setting of theLOCKTIMEOUTconfiguration parameter.
If the table fails to recover after 20 attempts, Vertica recovery fails. Multiple failed recovery attempts can delay node recovery.
Action: To resolve the issue, perform the following tasks:
- To track the recovery attempts, use the following command:
$ grep “incrCatchUpFailureCount” vertica.log
- Cancel the long-running DML operations.
If you are running Vertica 7.2.1, upgrade to Vertica 7.2.2, which allows recovery of multiple tables in parallel. For more information, see Recovery by Table in the Vertica documentation.

