


Vertica Integration with Metric Insights: Connection Guide
About Vertica Connection Guides
Vertica connection guides provide basic instructions for connecting a third-party partner product to Vertica. Connection guides are based on our testing with specific versions of Vertica and the partner product.
Vertica and Metric Insights: Latest Versions Tested
| Software | Version |
|---|---|
| Metric Insights |
5.5.0 Full |
| Metric Insights Platform |
CentOS 7.4 |
| Desktop Platform | Windows 10 Edge |
| Vertica Client |
Vertica 9.2.0 JDBC (included with Metric Insights 5.5.0) |
| Vertica Server | 9.2.0-0 |
Metric Insights Overview
Metric Insights’s Push Intelligence ensures that business users are receiving the right data, at the right time, on the right device. Sitting on top of your existing Business Intelligence and data infrastructure, Push Intelligence provides users with a single portal for all your Business Intelligence metrics, dashboards, and reports. Other features include: digest and burst emails, anomaly detection, event-based alerting and workflows, exception and change reports, and Slack integration.
For details about Metric Insights, visit the Metric Insights website.
Install Metric Insights
Metric Insights does not have a trial version available for download. To request a demo, you can complete the form available here:
https://www.metricinsights.com/schedule-a-demo
Metric Insights has several different deployment options, each with its own set of requirements. We suggest that you carefully review the deployment options and their respective system requirements at the following URL:
http://help.metricinsights.com/m/Deployment_and_Configuration
Note
Metric Insights uses JDBC to connect to the Vertica database. The Metric Insights installation includes the Vertica JDBC driver, so you do not need to install it separately.
Connect Metric Insights to Vertica
This section assumes you have Metric Insights installed locally.
In Metric Insights, Vertica is considered a JDBC Data Source(versus a plugin source). Details on how to establish a connection to a JDBC data source are covered in the Metric Insights documentation at the following URL:
http://help.metricinsights.com/m/Connecting_to_Data_Sources/l/104444-establishing-a-jdbc-connection
The following general steps apply to Vertica and several other products in this category:
-
In the Metric Insights web interface, log in as the Admin.
-
Select Data Sources from the Admin menu.
-
On the Data Sources page, click +New Data Sources.
- On the Type page, select SQL then click Next Step.
- Select Vertica from the JDBC Driver drop-down list.
-
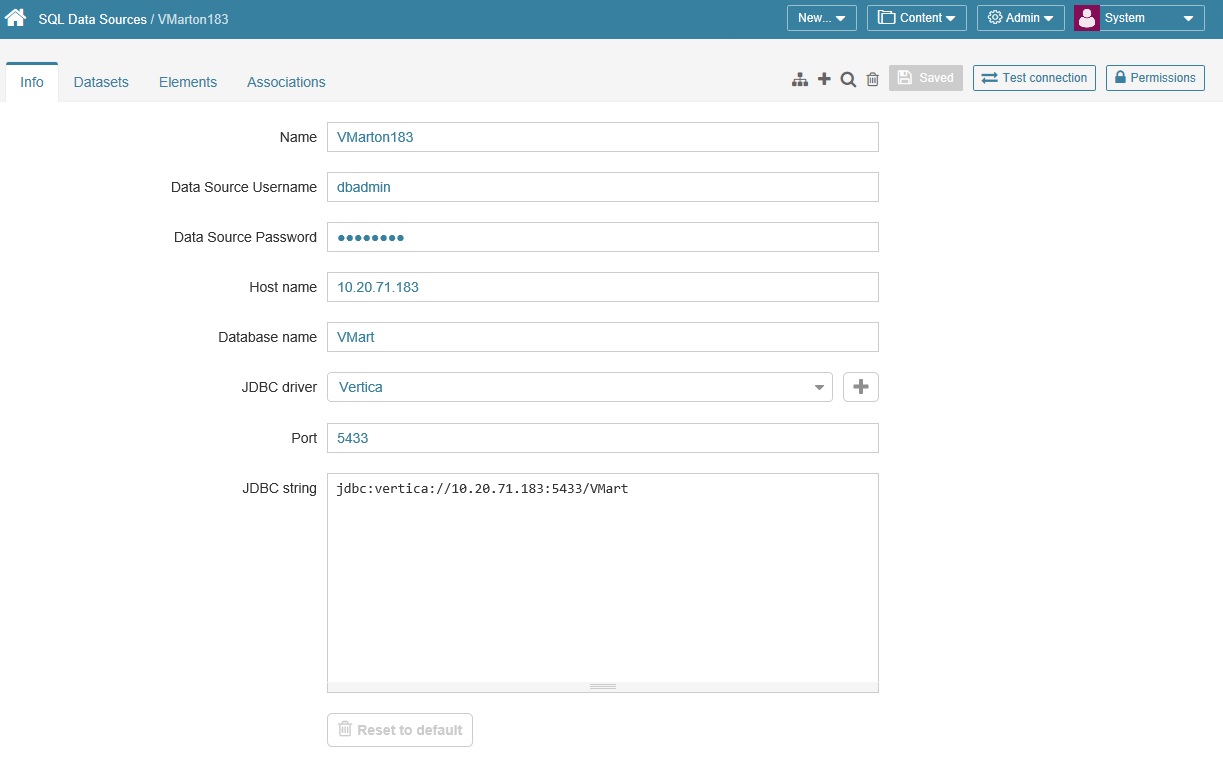
Fill in the Name through Port fields. Leave the rest at the defaults.
Note
Make sure to verify after the last field that the JDBC String has updated itself with your field values. It should look similar to the graphic below.
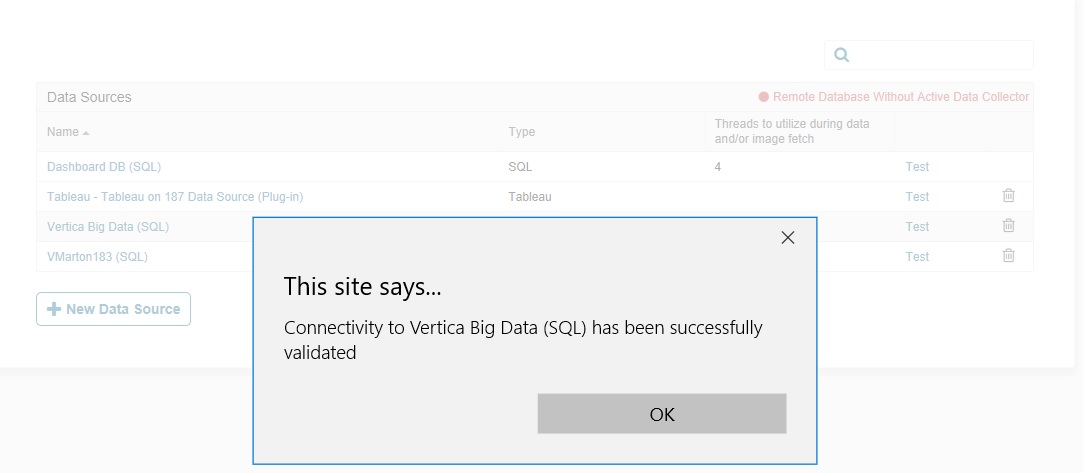
- Click Save.
-
Click Test Connection in the upper right of the page and confirm that the connection is successful.
-
To verify data-level connectivity with Vertica, follow these steps:
- Select Elements under the Content menu.
- Click +New Element.
- Make sure that Metric is selected, then click Next Step.
- In the New Element screen, select Monthly in the Measurement drop-down list, then click Next: Define details.
-
In the Metric Editor screen, type
select version()in the SQL statement field and click Validate below it.You should get a results window, similar to the screenshot below, stating that
Validation did not return expected results. The results will be the Vertica version of the source database.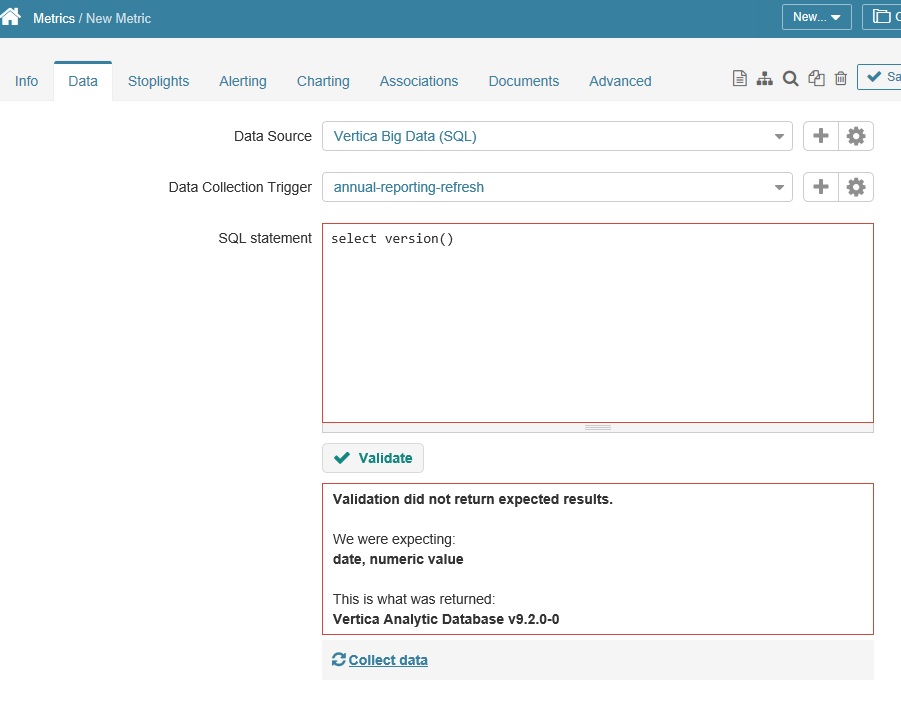
-
Click the Trash bucket on the top menu bar. Click again to confirm delete.
You have a working configuration at this point, so now you should refer to the Metric Insights documentation for details on building the desired dashboard tiles and applying Metric Insights capabilities such as notifications.
Troubleshooting the Dimension Value Limit
Metric Insights limits the number of values in a dimension to 1000 by default. If that limit is exceeded while Metric Insights is collecting dimension values, it may not indicate an error but simply continue to display the message:
Collecting dimension values
Find Out if You've Reached the Limit
If you suspect that the dimension value collection has been going on too long, you can find out if the limit has been exceeded as follows:
- On the Content menu, click Dimensions.
-
Check the column for the dimension you were adding.
If it says
1000, then select the dimension to edit it.This warning message will display in red at the top of the screen:
This Dimension has reached the maximum number of allowable values (1000). Additional dimension values can’t be loaded unless you increase the maximum number of dimension values that can be loaded for your instance.
If You Reach the Limit During Data Collection
You can increase the 1000 value limit for a given dimenion by editing the MAX_SEGMENT_VALUES_NUMBER setting. However, if you have already hit the 1000 limit, then the first 1000 have already been committed.
At this point, you could extend the limit and continue with the data collection, but, because Metric Insights checks existing data while collecting new data, the process will probably be slow. A better approach would be to delete the dimension, extend the limit, and then recreate the dimension so it collects from scratch instead of reconciling existing values.
Best Practice for Managing the Dimension Value Limit
Although Metric Insights offers a mechanism for extending the limit on a per-dimension basis, we do not recommend doing so.
If you do choose to extend the limit and the new limit is exceeded, then Metric Insights will display a warning when the limit is reached and will not collect any further values.
Important
We highly recommend that you not increase the dimension value limit. Instead, try to find a way to decrease the size of your dimensions.
The number of dimension values impacts time to collect each refresh interval, time to delete, and the number of tiles that will be created when this dimension is used. (See Time Series Requirement and Format for Metrics).
Known Issues
Time Series Requirement and Format for Metrics
If a dataset contains both metric and multi-metric elements, then the SQL for collecting the data from Vertica must include a date and/or time column. Also, the returned format must be one that Metric Insights can identify, such as the default format YYYY-MM-DD.
See the following Metric Insights article for details:
Performance Observations
We found performance issues in the following areas:
-
In the Data tab of a Report object, you can click Show Data to display the results of the SQL query you entered.
If the data being fetched includes a large Char/Varchar value, it can take a significant amount of time to display the results. The display does not wrap the data, but you can hover over it to see the full details. If you hover over one of the large values, the screen can stop responding for several seconds, making it appear like the app has hung.
-
In the Data tab of a Dataset object, you can click Validate to validate the data. The display behavior here is the same as we found with Show Data in Reports.
A table with a Long Varchar(32000000) column with a 130K byte value took 40 seconds to Show/Validate. It took 3 minutes for the hover to release the screen.
-
In creating a dimension, there is a similar screen where you specify the SQL query that will fetch the desired result set. There are Check Values and Collect Data buttons.
Check Values is reasonably fast, but Collect Data gets exponentially slower as the number of values increases. It took only seconds to collect the data for a dimesnion with 50 values. But it took almost 3 minutes to collect the data for a dimension with 1000 values.
In all the cases above, the vertica.log and system tables showed the queries were executed in milliseconds on the Vertica side. So whatever time was being spent seemed to be on the Metric Insights side.
Data Type Limitations
Date
Validating, showing, or collecting a table that includes date values less than 1900-01-01 00:00:00 returns an error:
Validating Report 22's failed. Some data inconsistent with the majority of the content: column 'Date_Column', type 'DATE', cell(s): row 1, value '0001-01-01 00:00:00'
Metric Insights valid value range for the Date type is 1900-01-01 00:00:00 — 9999-01-01 00:00:00.
Intervals
Intervals are unsupported data types. They will not generate an error, but the wrong data will be written. For example:
- Interval Second shows values as
{u'm_second': 2, u'm_minute': 0, u'fracPrecision': 0, u'm_fraction': 0, u'm_intervalType': 112, u'm_day': 0, u'm_isNegative': False, u'm_hour': 1} - Interval Month shows values as
(u'm_isNegative': False, u'm_month': 10, u'm_intervalType': 107, u'm_year': 9}
LongVarBinary
A Long Varbinary column value can be no more than 2.64M in length. If the column value is too large, the following error is raised:
The first n rows of the result set can not be processed because the data set is too large.
Time and TimeTz
In both Time and TimeTz, the values are treated as Date Time. Milliseconds are dropped and the Unix epoch 1970-01-01 is added, preceding the time. In the TimeTz case, the +–n is also dropped.
Timestamp and TimestampTz
Metric Insights supports these data types, but the valid value range is 1900-01-01 00:00:00 - 9999-01-01 00:00:00. Any values outside the range will cause this error to appear:
Validating Report 36's failed. Some data inconsistent with the majority of the content: column 'Timestamp_Column', type 'DATE', cell(s): row 1, value '0001-01-01 00:00:00' column 'Timestamp0_Column', type 'DATE', cell(s): row 1, value '0001-01-01 00:00:00' column 'DateTime_Column', type 'DATE', cell(s): row 1, value '0001-01-01 00:00:00' column 'SmallDatetime_Column', type 'DATE', cell(s): row 1, value '0001-01-01 00:00:00' column 'Timestamp6_Column', type 'DATE', cell(s): row 1, value '0001-01-01 00:00:00'
In both Timestamp and TimestampTz, , the values are treated as Date Time. Milliseconds are dropped. In the TimestampTz case, the +–n is also dropped.

