Monitoring Depot Content in MC
You can monitor in detail how the nodes in your Eon database are using the depot:
- Display a list of tables with the largest amount of data in the depot.
- Use the filter fields to list the tables most frequently or most recently accessed in the depot.
- Display details about how frequently the projections and partitions for a specific table access the depot, and the last time the depot was accessed.
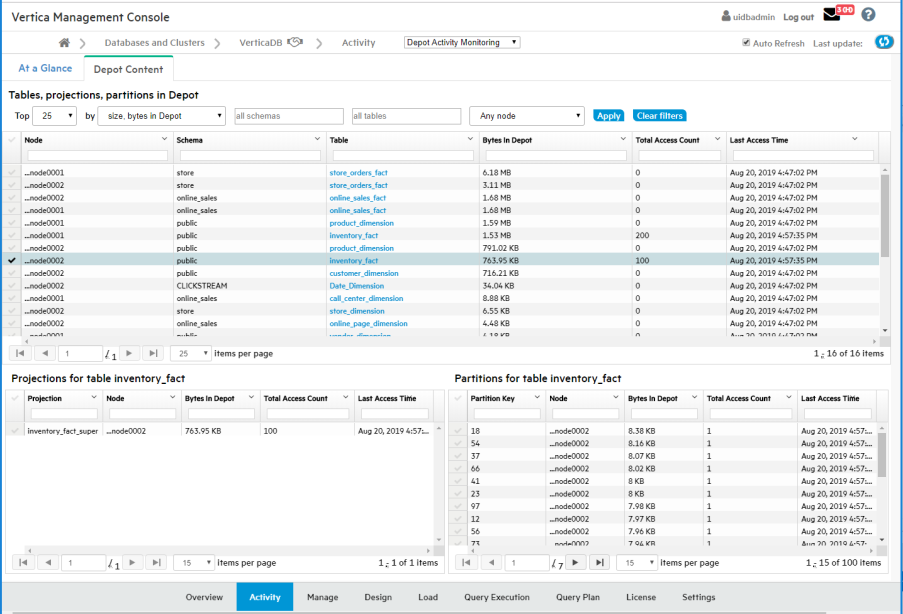
The Depot Activity Monitoring > Depot Content tab opens showing a default list of the top 25 tables in the database, as ranked by each table's total bytes in the depot. The list shows all the nodes for each of those top tables. The nodes are sorted solely based on most bytes in depot, so the nodes for a given table do not necessarily appear together.
Filter the List
You can use the filter fields above the table to focus the list more narrowly. The filters let you select:
- The number of top tables
- Whether the tables are selected by most bytes in depot, the highest number of times their depot was accessed, or the most recent last access time
- Tables in all schemas, or only in a specific schema
- All tables, or only a specific table
- All nodes, or only a specific node
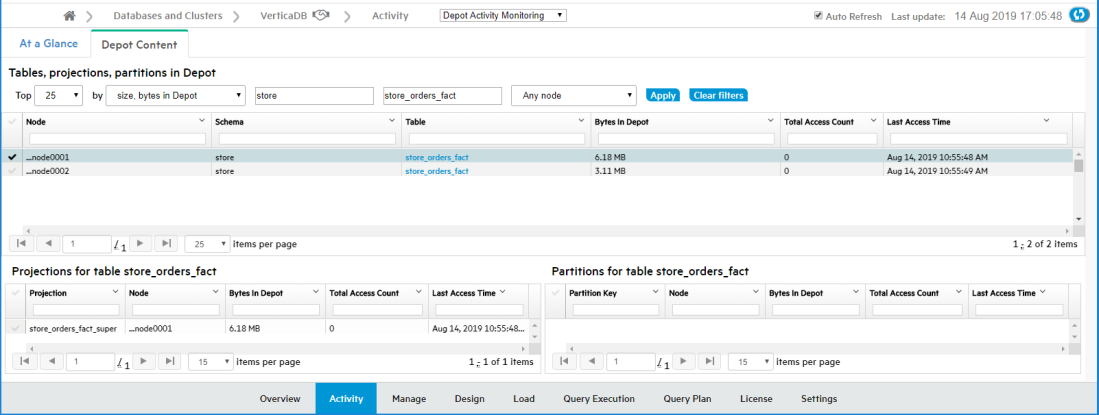
In the Schema, Table, and Node filter fields, you can enter a text string to select all items whose names include that text string.
Select a Node to See the Breakdown of Depot Data in Projections and Partitions
Select a row in the top table. MC then loads the details to show how that table's depot content is distributed across the projections and the partitions for that table, that are on that node. The Projection and Partition panes show these details for the selected node:
- Projection: Number of bytes of data for the selected table that each projection has in the depot on the selected node.
- Partition: If the table is partitioned, this pane shows the number of bytes of data for the selected table that each partition has in the depot on the selected node.
For each projection and each partition, MC also displays the total number of times, that the projection or partition has accessed the depot on that node, and the last access time.
For more information about projections, see Working with Projections.
For more information about partitions, see Partitioning Tables.
Steps to Monitor Depot Content
-
From the MC home page, open a database, select the Activity tab from the bottom menu, select Depot Activity Monitoring in the top selection box, and select the Depot Content tab. MC displays the top N tables (25 by default), ranked by the number of bytes of data each table has in the depot on all its nodes.
- To narrow the list, use the filters at the top of the tab. You can show only the nodes in a certain schema and/or database, or display all the activity on a specific subgroup of nodes. Change the filters, then click Apply.
-
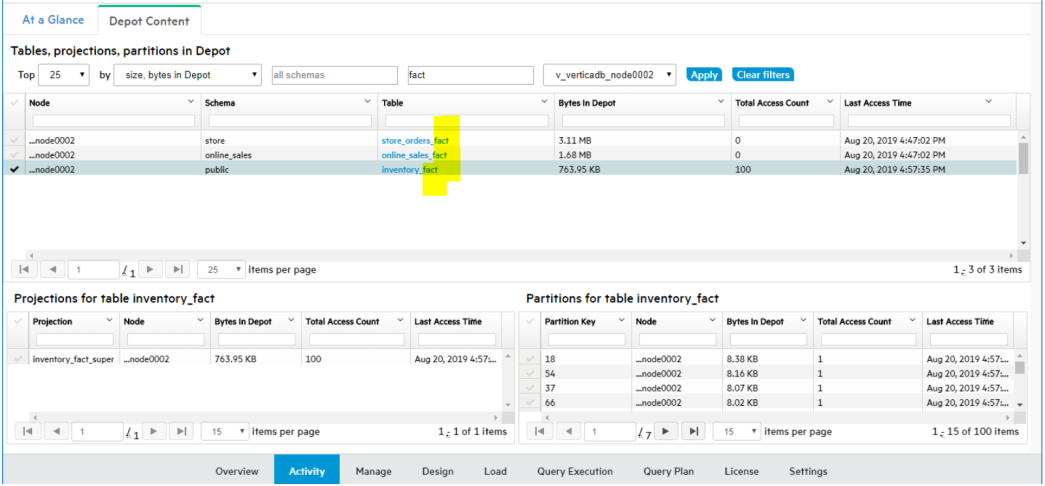
To select all items whose names contain a certain text string, enter that text string in a filter field. This example selects the nodes for the tables whose names contain the string "fact".
-
To display details on the projections and partitions for a specific table that are accessing the depot, select a row in the top pane of the Depot Content tab.