Monitoring Table Utilization and Projections
The Table Utilization activity page helps you monitor tables and projections in your database by schema.
Use the Table Utilization charts for a listing of all the tables in a schema, which you can filter and sort; or view them by size and usage in a treemap visualization. These charts allow you to identify outliers among your tables, such as those that are large or overused.
The Projections Summary, located on the right side of the page, provides an overview of the projections in the schema. You can use this summary to help identify if projections are evenly distributed across nodes.
Visualize Tables
MC shows you the public schema by default. To specify which schema to view, choose one from the Schemas menu at the top of the activity page. The summary of tables and projections in that schema appear on the page.

MC visualizes your available tables by schema in a table chart or as a treemap chart. From the Show As menu, choose Table for a tabular chart or Map for a treemap chart. By default, MC displays the Table chart.

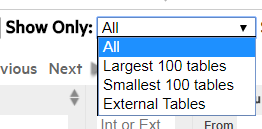
Depending on the number of tables in the schema, the chart may be crowded. To narrow it down, use the Show Only filter at the top of the page to display only the largest 100 tables, smallest 100 tables, or external tables.
View the Table Chart
The Table chart is a tabular view of the schema's table data. Use the tabular view to filter or sort on any columns, and view the explicit values for row counts and utilization.
The columns display each table's:
- Table Name. Click this name to see the Table Details page.
- Table Type: Internal, Working with External Data or HCatalog. (Details such as row count and usage are not available for external and HCatalog types.)
- Row Count.
- Usage in Queries, by percentage of time the table is queried.
- Row count and Usage, visualized as a bar. The length of the bar indicates row count; a darker color indicates higher usage.
- Table Definition. The COPY statement table definition, only applicable to external tables.
Hover over any row in the chart to view the table's properties (shown for inventory_fact in the screen capture below). Click the table name to view its more in-depth Table Details page.

View the Treemap Chart
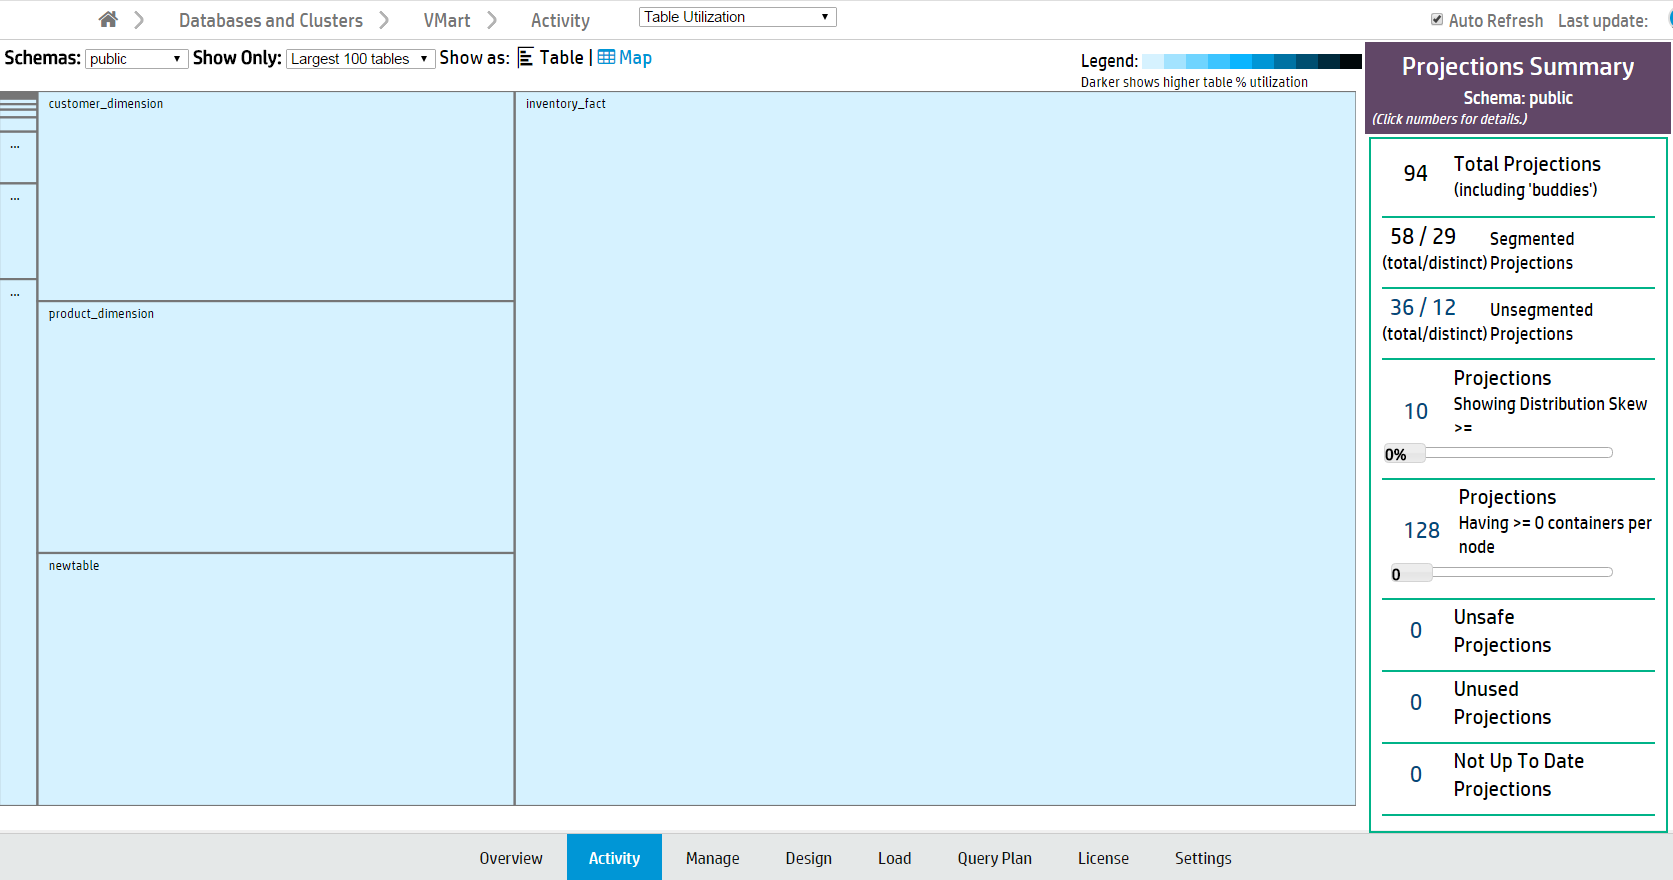
In the Treemap visualization, tables are represented by boxes, nested by size and colored by usage. Darker colors indicate higher table usage.
Hover over a table to view more details, or click to view its Table Details page.
View Table Details
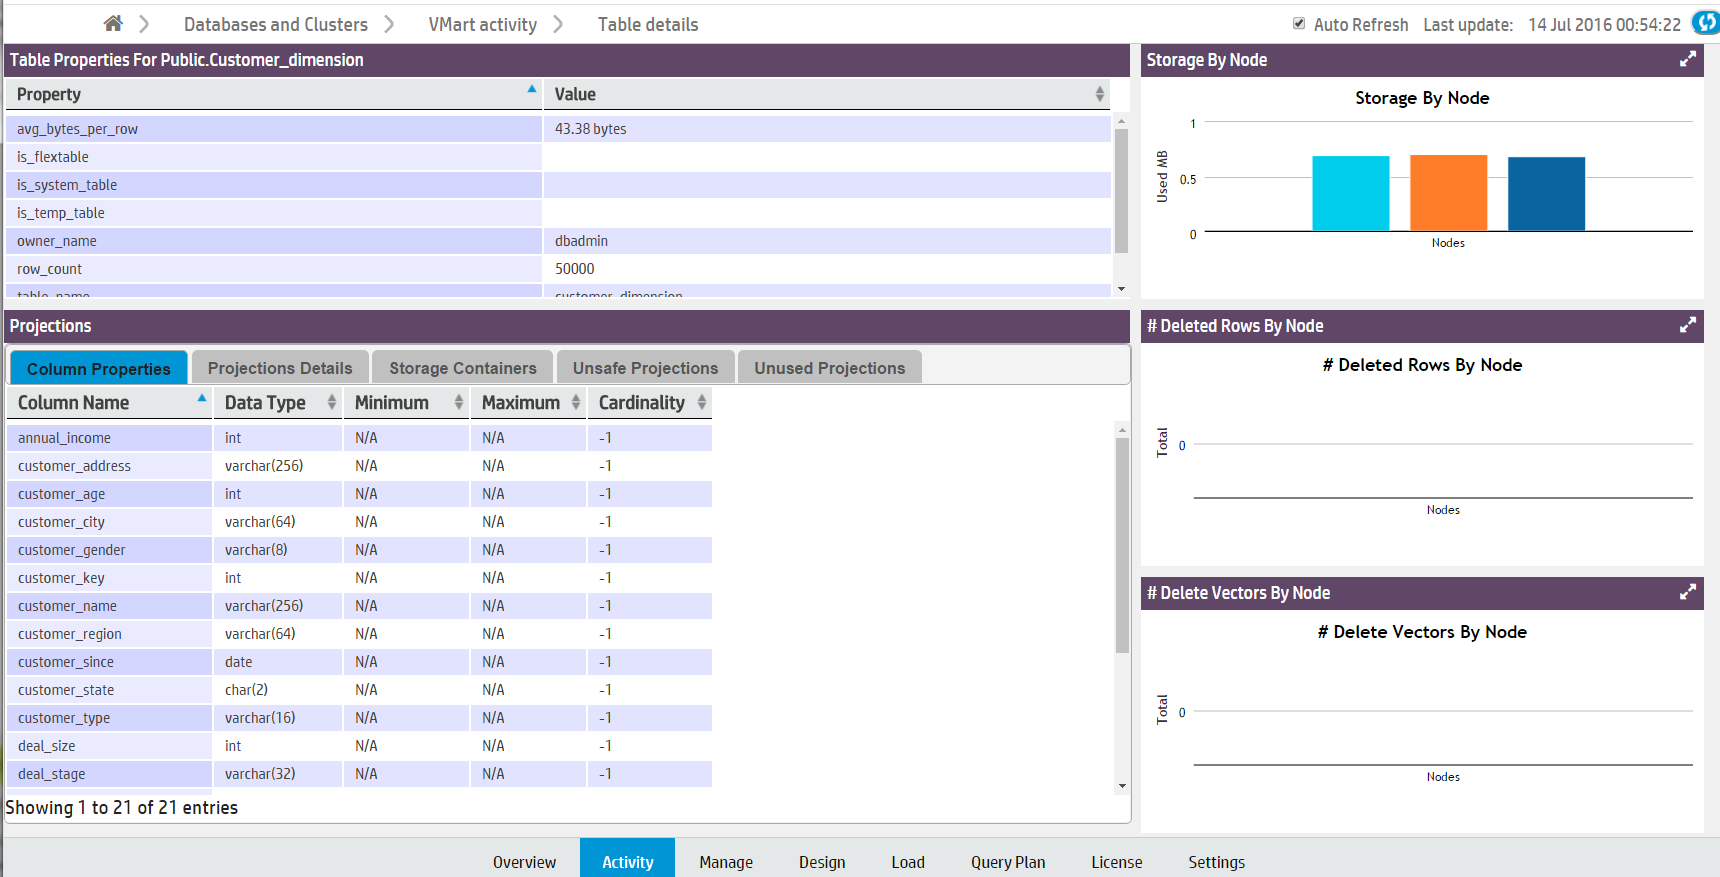
The Table Details page displays a detailed overview of internal Vertica tables. (This is not available for external and HCatalog tables.) Click a table name on the Table Utilization Activity page to open its Table Details page in a new window.
You can view the following details:
- Table Properties. Table properties (such as row count and owner).
- Projections. The properties of the table's columns and projections.
- Storage by Node. The table's storage utilization per node, in MB.
- # Deleted Rows by Node. Vertica allocates physical storage to deleted rows until they are purged by the Tuple Mover.
- # Delete Vectors by Node. Vertica creates small containers called delete vectors when DELETE or UPDATE statements run on a table. A large number of delete vectors can negatively impact performance. (See Mergeout.)
Projections Summary
The Projections Summary is located in a side bar on the right side of the Table Utilization page. It displays the following statistics of all projections in a schema:
- Total projections.
- Segmented projections, the number of projections segmented across multiple nodes.
- Unsegmented projections, the number of projections that are not segmented across multiple nodes.
- Projections Showing Distribution Skew, the number of projections unevenly distributed across nodes. Tables with fewer than 1000 rows are not counted. Move the slider to configure filter by distribution skew percentage.
- Projections Having >= Containers Per Node. Move the slider to specify the minimum number of containers.
- Unsafe Projections, the number of projections with a K-safety less than the database's K-safety.
- Unused Projections.
- Not Up to Date Projections.
Click a projections number to view a list of the specified projections and their properties. For more about projections, see Working with Projections.
See Also
- Working with Vertica-Managed Tables
- Working with Projections
- Working with External Data
- Using the HCatalog Connector
