EXPLAIN Output Options
By default, EXPLAIN output represents the query plan as a hierarchy, where each level (path) represents a single database operation that the optimizer uses to execute a query. EXPLAIN output also appends DOT language source so you can display this output graphically with open source Graphviz tools.
You can qualify EXPLAIN with three output options:
JSONproduces the query plan in JSON format.VERBOSEincreases the amount of detail in the rendered query plan. This option is valid for default and JSON output.LOCAL(on a multi-node database) shows the local query plans assigned to each node, which together comprise the total (global) query plan. If you omit this option, Vertica shows only the global query plan. Local query plan are shown only in DOT language source, which can be rendered in Graphviz.
You can also write EXPLAIN output to a file.
JSON Output
The following EXPLAIN statement specifies the same query shown earlier, but this time specifies to produce output in JSON format:
=> EXPLAIN JSON SELECT customer_name, customer_state FROM customer_dimension WHERE customer_state IN ('MA','NH') AND customer_gender='Male' ORDER BY customer_name LIMIT 10;


 QUERY PLAN DESCRIPTION:
 ------------------------------

 Opt Vertica Options
 --------------------
 PLAN_OUTPUT_JSON


 EXPLAIN JSON SELECT customer_name, customer_state FROM customer_dimension WHERE customer_state IN ('MA','NH') AND customer_gender='Male' ORDER BY customer_name LIMIT 10;

 -----------------------------------------------------------------
 JSON format:

 {
     "PATH_ID" : 0,
     "PATH_NAME" : "SELECT",
     "EXTRA" : " LIMIT 10",
     "COST" : 365.000000,
     "ROWS" : 10.000000,
     "COST_STATUS" : "GOOD",
     "TUPLE_LIMIT" : 10,
     "EXECUTE_NODE" : "Query Initiator",
     "INPUT" : {
         "PATH_ID" : 1,
         "PATH_NAME" : "SORT",
         "EXTRA" : "[TOPK]",
         "COST" : 365.000000,
         "ROWS" : 544.000000,
         "COST_STATUS" : "GOOD",
         "ORDER" : ["customer_dimension.customer_name", "customer_dimension.customer_state"],
         "TUPLE_LIMIT" : 10,
         "EXECUTE_NODE" : "Query Initiator",
         "INPUT" : {
             "PATH_ID" : 2,
             "PATH_NAME" : "STORAGE ACCESS",
             "EXTRA" : "for customer_dimension",
             "COST" : 326.000000,
             "ROWS" : 544.000000,
             "COST_STATUS" : "GOOD",
             "PROJECTION" : "public.customer_dimension_DBD_1_rep_VMartDesign_node0001",
             "MATERIALIZE" : ["customer_dimension.customer_state", "customer_dimension.customer_name"],
             "FILTER" : ["(customer_dimension.customer_gender = 'Male')", "(customer_dimension.customer_state = ANY (ARRAY['MA', 'NH']))"],
             "EXECUTE_NODE" : "Query Initiator"
         }
     }
 }
 End JSON format
 ------------------------------
(51 rows)
VERBOSE Output
The following EXPLAIN statement specifies the same query shown earlier, but this time specifies to produce verbose output (added information is set off in bold):
 QUERY PLAN DESCRIPTION:
 ------------------------------

 Opt Vertica Options
 --------------------
 PLAN_OUTPUT_SUPER_VERBOSE

 EXPLAIN VERBOSE SELECT customer_name, customer_state FROM customer_dimension
 WHERE customer_state IN ('MA','NH') AND customer_gender='Male'
 ORDER BY customer_name LIMIT 10;

Access Path:
+-SELECT  LIMIT 10 [Cost: 365.000000, Rows: 10.000000 Disk(B): 0.000000 CPU(B): 0.000000 Memory(B): 0.000000 Netwrk(B): 0.000000 Parallelism: 1.000000] [OutRowSz (B): 274] (PATH ID: 0)
|  Output Only: 10 tuples
|  Execute on: Query Initiator
|  Sort Key: (customer_dimension.customer_name)
|  LDISTRIB_UNSEGMENTED
| +---> SORT [TOPK] [Cost: 365.000000, Rows: 544.000000 Disk(B): 0.000000 CPU(B): 1275443.584695 Memory(B): 149056.000000 Netwrk(B): 0.000000 Parallelism: 1.000000] [OutRowSz (B): 274] (PATH ID: 1)
| |      Order: customer_dimension.customer_name ASC
| |      Output Only: 10 tuples
| |      Execute on: Query Initiator
| |      Sort Key: (customer_dimension.customer_name)
| |      LDISTRIB_UNSEGMENTED
| | +---> STORAGE ACCESS for customer_dimension [Cost: 326.000000, Rows: 544.000000 Disk(B): 0.000000 CPU(B): 0.000000 Memory(B): 0.000000 Netwrk(B): 0.000000 Parallelism: 1.000000] [OutRowSz (B): 274] (PATH ID: 2)
| | |      Column Cost Aspects: [ Disk(B): 410928.432432 CPU(B): 111588.324324 Memory(B): 4498570.572304 Netwrk(B): 0.000000 Parallelism: 1.000000 ]
| | |      Projection: public.customer_dimension_DBD_1_rep_VMartDesign_node0001
| | |      Materialize: customer_dimension.customer_state, customer_dimension.customer_name
| | |      Filter: (customer_dimension.customer_gender = 'Male')/* sel=0.351351 ndv= 2 */
| | |      Filter: (customer_dimension.customer_state = ANY (ARRAY['MA', 'NH']))/* sel=0.030928 ndv= 4 */
| | |      Execute on: Query Initiator
| | |      Sort Key: (customer_dimension.customer_type, customer_dimension.store_membership_card, customer_dimension.title, customer_dimension.customer_region, customer_dimension.number_of_children, customer_dimension.customer_key)
| | |      LDISTRIB_SEGMENTED
Local Output
The following statement includes the LOCAL option:
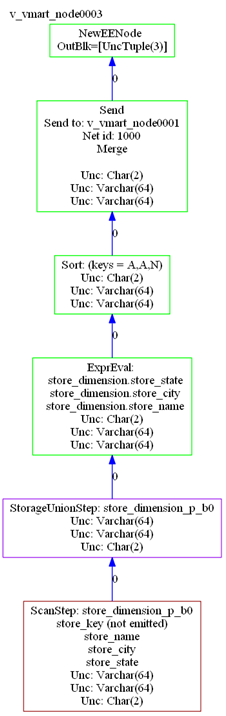
=> EXPLAIN LOCAL SELECT store_name, store_city, store_state
   FROM store.store_dimension ORDER BY store_state ASC, store_city ASC;
The output includes GraphViz source, which describes the local query plans assigned to each node. For example, output for this statement on a three-node database includes a GraphViz description of the following query plan for one node (v_vmart_node0003):
 -----------------------------------------------
 PLAN: v_vmart_node0003 (GraphViz Format)
 -----------------------------------------------
 digraph G {
 graph [rankdir=BT, label = "v_vmart_node0003\n", labelloc=t, labeljust=l ordering=out]
 0[label = "NewEENode \nOutBlk=[UncTuple(3)]", color = "green", shape = "box"];
 1[label = "Send\nSend to: v_vmart_node0001\nNet id: 1000\nMerge\n\nUnc: Char(2)\nUnc: Varchar(64)\nUnc: Varchar(64)", color = "green", shape = "box"];
 2[label = "Sort: (keys = A,A,N)\nUnc: Char(2)\nUnc: Varchar(64)\nUnc: Varchar(64)", color = "green", shape = "box"];
 3[label = "ExprEval: \n  store_dimension.store_state\n  store_dimension.store_city\n  store_dimension.store_name\nUnc: Char(2)\nUnc: Varchar(64)\nUnc: Varchar(64)
", color = "green", shape = "box"];
 4[label = "StorageUnionStep: store_dimension_p_b0\nUnc: Varchar(64)\nUnc: Varchar(64)\nUnc: Char(2)", color = "purple", shape = "box"];
 5[label = "ScanStep: store_dimension_p_b0\nstore_key (not emitted)\nstore_name\nstore_city\nstore_state\nUnc: Varchar(64)\nUnc: Varchar(64)\nUnc: Char(2)", color
= "brown", shape = "box"];
 1->0 [label = "0",color = "blue"];
 2->1 [label = "0",color = "blue"];
 3->2 [label = "0",color = "blue"];
 4->3 [label = "0",color = "blue"];
 5->4 [label = "0",color = "blue"];
 }
GraphViz renders this output as follows:
Writing EXPLAIN Output to a File
To save EXPLAIN output to a file, use the vsql\o command:
-
Turn on saving output to a file using the
\ocommand. For example:vmartdb=>
\o /home/dbadmin/my-plan-output -
Use EXPLAIN to obtain the desired query plan:
vmartdb=>
EXPLAIN SELECT * FROM customer_dimension; -
Turn off saving output to a file using the
\ocommand.vmartdb=>
\o
Note: The \o command continues to write command-line output to the file until you reissue the \o command.
