Vertica’s native ingest, data preparation, and model management features cover the entire data mining lifecycle, eliminating the need to export and load data into another tool for analysis, and then export the results back into Vertica.
Users can prepare data with functions for normalization, outlier detection, sampling, imbalanced data processing, missing value imputation and more. The purpose of normalization is, primarily, to scale numeric data from different columns down to an equivalent scale. For example, suppose you execute the LINEAR_REG function on a data set with two feature columns, current_salary and years_worked. The output value you are trying to predict is a worker’s future salary. The values in the current_salary column are likely to have a far wider range, and much larger values, than the values in the years_worked column. Therefore, the values in the current_salary column can overshadow the values in the years_worked column, thus skewing your model.
Vertica In-database Machine Learning
See how Vertica’s in-database machine learning supports the entire predictive analytics process with massively parallel processing and a familiar SQL interface, allowing data scientists and analysts to embrace the power of Big Data and accelerate business outcomes with no limits and no compromises.
Vertica offers the following data preparation methods for normalization:
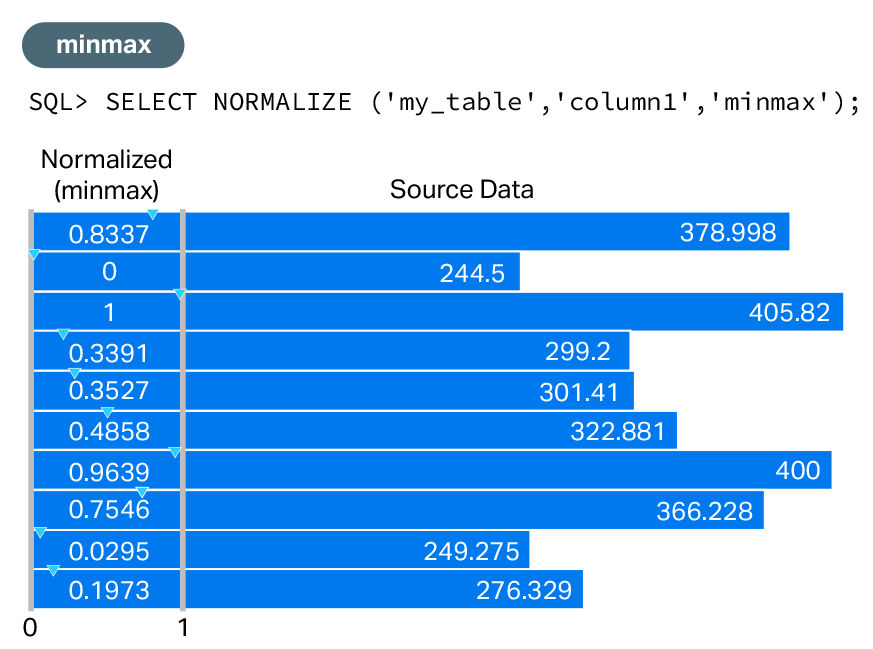
MinMax
Using the MinMax normalization method, you can normalize the values in both of these columns to be within a distribution of values between 0 and 1. Doing so allows you to compare values on very different scales to one another by reducing the dominance of one column over the other.
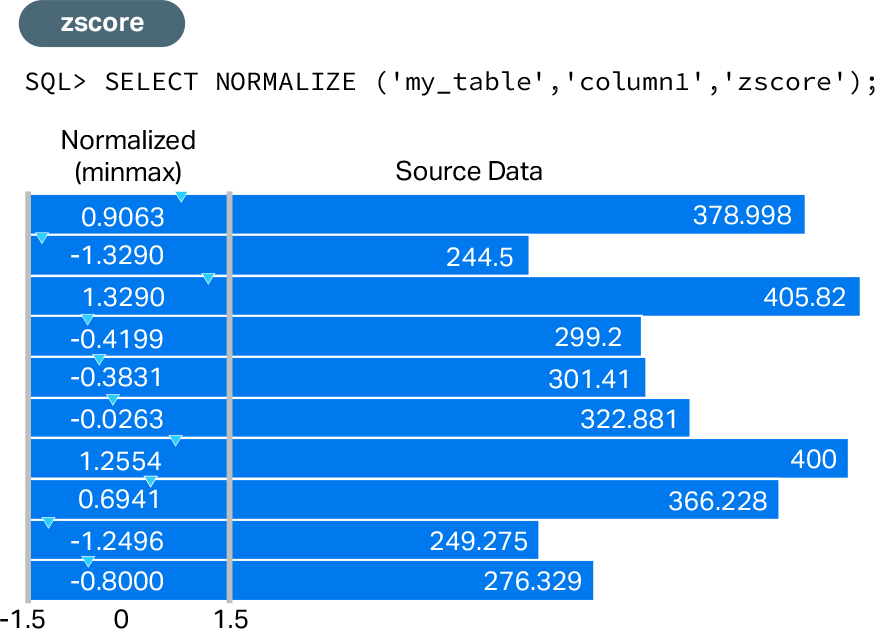
Z-score
Using the Z-score normalization method, you can normalize the values in both of these columns to be the number of standard deviations an observation is from the mean of each column. This allows you to compare your data to a normally distributed random variable.
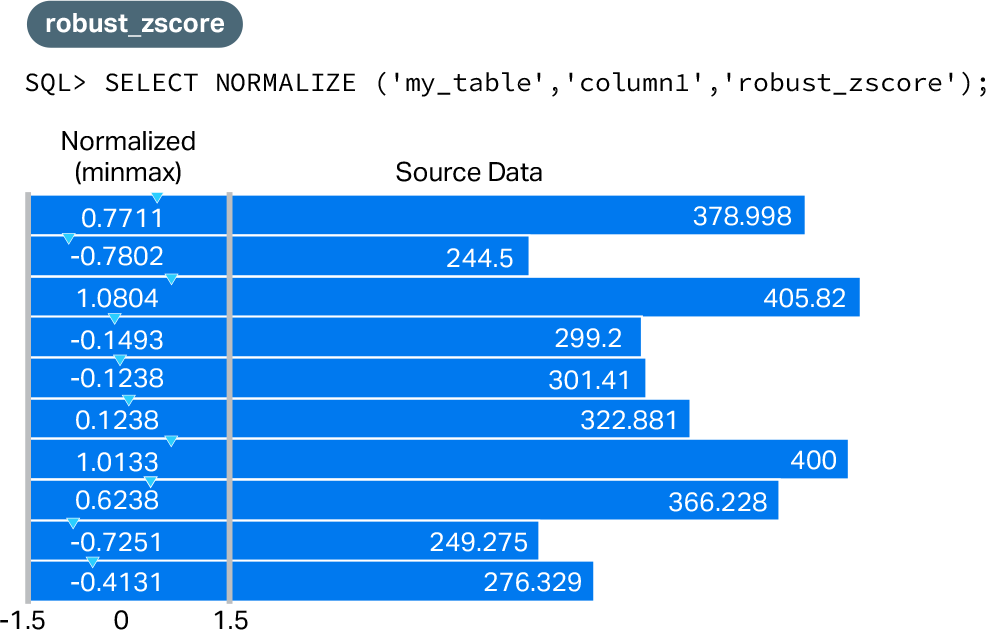
Robust Z-score
Using the Robust Z-score normalization method, you can lessen the influence of outliers on Z-score calculations. Robust Z-score normalization uses the median value as opposed to the mean value used in Z-score. By using the median instead of the mean, it helps remove some of the influence of outliers in the data.
Normalizing Data Using the MixMax Function in Vertica
The following chart compares raw, source data vs. normalized data that has been transformed using the MinMax normalization function in Vertica.


Normalizing Data Using the Z-score Function in Vertica
The following chart compares raw, source data vs. normalized data that has been transformed using the Z-score normalization function in Vertica.
Normalizing Data Using the Robust Z-score Function in Vertica
The following chart compares raw, source data vs. normalized data that has been transformed using the Robust Z-score normalization function in Vertica.


