Those of you who read my blog post “Take nothing but memories. Leave nothing but footprints” may recall my passion for using Raspberry Pi computers to capture IoT data from aeroplane transponders and GPS satellites, then feeding that streaming data into Apache Kafka and to integrate it with Vertica and perform near real-time analytics and machine learning. In that blog post, I talked about how, with a Raspberry Pi and a low-cost USB GPS Receiver, I could track the movements of my wife as she drove her BMW X5 to the supermarket (via the car wash), and how I drew a 1,000 ft piece of Vertica graffiti in the sand.
However, other than demonstrating how easy it is to capture live IoT data and feed it within seconds into Vertica – where it could be immediately analyzed and visualized – I didn’t really delve into any of the in-database SQL functions that Vertica supports. So, I decided it was time to look at just ONE of the more than 650 in-database Vertica functions and demonstrate the power and flexibility of Vertica. I also wanted to make this a little more interesting by referring to the manual typewriter – as in the image above – and how, like most mechanical devices, they are prone to failure.
I am of an age where I can remember using a mechanical typewriter to type manuscripts and letters – yep, that’s what we did in the 1970s, before we had email. We had manual typewriters and Dictaphones, and secretaries would boast of their typing speed at 70+ words-per-minute and their abilities to capture speech in Pitman shorthand. Many words and phrases we use today came into being, including “carriage return, line feed [CR LF]”, “carbon copy [CC]”, and many more.
Not long before that time, the QWERTY keyboard layout had been established, which placed the most-used typewriter keys beneath the typist’s weakest fingers, so the mechanical dyes would be less likely to connect, and stick, as they flew past each other. It slowed down the typist, essentially. And though the electronic keyboard has long solved the “stuck like a typewriter” problem, we’re still “stuck” with a keyboard layout designed for yesteryear’s technology.
The terms of a bygone era
As I mentioned, the manual typewriter provided us with a number of words and phrases that remain in common use today. But if you were born after the 1990s, you are unlikely to know the origin of these. Thus, I will start by giving a quick overview of one of these phrases – Carriage Return, Line Feed [CR/LF].
Commercial typewriters became available in the late 1800s and were commonplace in most offices until the 1980s. These mechanical devices have an array of keys such that when any single key is pressed by a finger, it flips a metal arm with an die-cast character onto an inked ribbon, which sits above a bound sheet of paper. The paper on which the characters are printed moves to the left, character by character.
The moving carriage is positioned at the top of the typewriter and consists of a rubber platen, roller knobs, paper guides, bail rollers, roller bar, and margin tabs. The carriage progresses to the left, until the typed line arrives at its designated margin. To the left-hand side of a typewriter is a metal arm called the carriage return [CR] which the user then pushes manually to the right, thus returning to the left margin of the paper and mechanically rotating the paper upward by one (or more) lines. This is what is referred to as the line feed [LF], making the paper ready for continued typing.
But what would happen if the typewriter’s Line Feed capability were broken? Imagine that the carriage return [CR] is working fine – in that the paper gets returned to the left-hand side – but without the Line Feed [LF], the next set of characters would get imprinted over the previous line. This would result in an illegible mess, with each new line imprinted over the previous ones. .
How to make a messy line of type in the sand
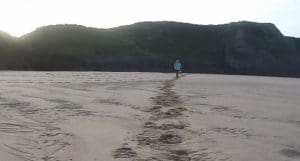
But I wasn’t going to use a typewriter to simulate this. It’s far more fun to take to my local beach and write, then overwrite, words in the sand. As described in my earlier blog post, I was armed with the Raspberry Pi and GPS receiver in my backpack to track my steps, feeding live data via my cell phone into a Kafka broker in the cloud, with Vertica’s Kafka scheduler uploading the data in 20-second micro batches. I was then able to visualise my route using one of the many 3rd-party tools that seamlessly integrate with Vertica.
My session commenced at 4:30am on a Saturday morning in June 2022. Starting by walking along the baseline to return the carriage to the start of the line, then from left (west) to right (east), I drew the first character of the first word by pacing a predetermined number of steps to trace a character in the sand.


For example, a capital “E” would be drawn as follows. Starting in the lower left corner, I would walk 20 steps north to draw the left-hand spine of the “E”. Then 8 steps east to draw the upper horizontal line, and as I need to return to the left-hand spine, I would retrace my 8 steps before stepping 10 steps south, 8 steps east and back to draw the centre horizontal line. Finally, 10 steps south (to the lower left-hand corner), before drawing the 8-step lower horizontal and then returning to the lower left-hand corner.
In case you were wondering, I didn’t start with an “E” – that’s just one of the easier letters to describe!
With the first letter now “typed”, I moved along the baseline to the starting point of the second letter, and so on. Between each character, I momentarily paused for a couple of seconds, as if trying to find the next letter on the keyboard. At the end of the first complete word, I returned the carriage to the start of the line, but without a Line Feed, to write the second word, I scratched the new letter over top of the existing one, and repeated the process for the remaining letters and words.
Had I been using a real typewriter, I would probably be writing more than one word per line, but with a fast-rising tide, and each character taking so long to write, I decided on one word per line.
As with pausing between each character, as I returned to the start of the line, poised to type the next word, I paused for a couple of seconds. I’m clearly not as young as I used to be, and I needed to pause briefly before commencing the next word.
Next, a little reconnaissance from above
Once I had completed my choice of words, I walked from the beach to the overlooking cliff to look down on my handiwork and take some photographs. In keeping with the manual typewriter theme, I would have loved to use a Brownie box camera, or even one of my 35-mm SLR cameras. But since I was using a Raspberry Pi computer, I decided to capture the moment using a more modern Sony digital camera.
My Mum (Eileen), who happened to turn 80 this year, had a career as a shorthand typist. She could take shorthand at 120 words per minutes (wpm) and used a manual typewriter at speeds in excess of 70 wpm. By contrast, I had written just four words; and although I did not keep an exact record, I estimate it took me approximately 45 minutes to write those four words, thus 11 minutes per word – mpw – rather than wpm!
Of course, writing words in the sand quickly wasn’t my goal. The exercise was all about seeing what I could do with the data that I had captured, and speed wasn’t a factor here. Returning home, I logged into my Vertica database with great anticipation.
Before looking at the data, I decided to download those digital pictures and see if I could decipher the message with my own eyes.
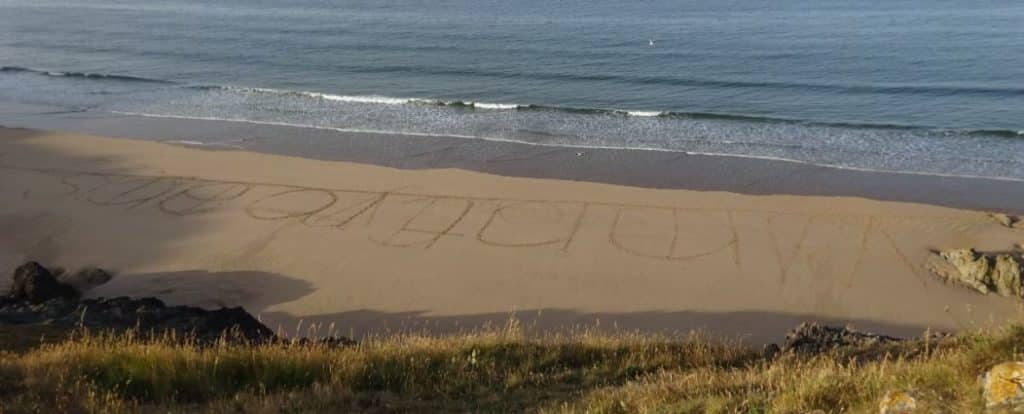
Yes, I knew exactly how many words and letters there were, and which characters made up those words. But just looking down from the cliff to that jumbled mess, although I could make out a couple of the letters, I really struggled to make out a clear picture of what the words said. Had I written hundreds, or thousands of words, that challenge of deciphering the text would be even more difficult, if not impossible.
Let the deciphering begin!
With GPS coordinates being captured every second, I started by taking the full data set and visualizing it using one of the many BI visualisation tools that Vertica integrates with: Tableau.
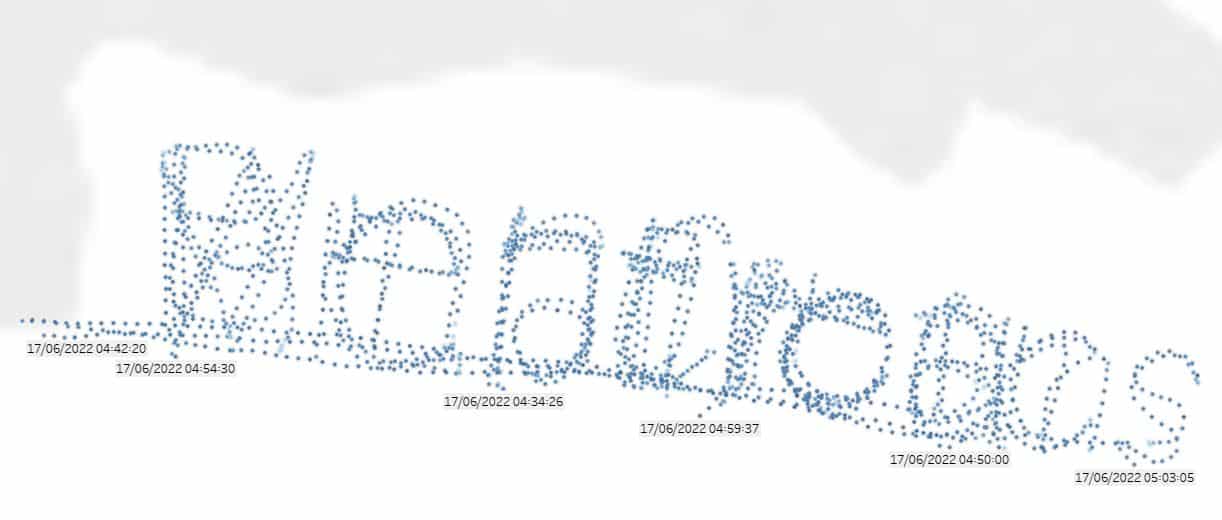
As you can see, with all the data points presented, it is nigh impossible to decipher the phrase.
If I were a data scientist, I would have to spend a huge amount of time looking at this data and trying to understand and prepare it for analysis. However, there are a number of really important pieces of information one can easily gather just by looking at the raw data.
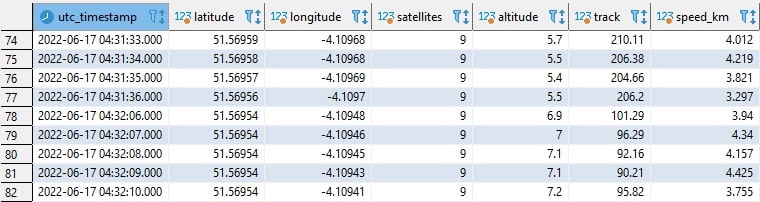
For instance, we can see that this clearly represents time series data, and it would appear we are capturing data points consistently at 1-second intervals. Additional data points are latitude, longitude, and altitude (in meters). We can also observe the number of satellites determining the GPS coordinates (8-9 is far more than we need); also, the track direction in degrees, and the speed in km per hour I was walking. While I know 3-4 km per hours is rather slow, I was walking in relatively soft sand and trying to count the number of paces I was making.
To simplify this analysis, I set my ETL application to only record data when I was moving. This means that if we look closer at the data, there are clear gaps in the time series sequence, such as I’ve circled here, where there are 30 seconds between the two readings:

Corresponding to what I mentioned earlier about pausing between writing each letter, there are slightly longer gaps between writing each new word.
Vertica’s Event-Based Windows to the rescue
Vertica has a number of event-based window functions that allow us to break up time series data into windows based on significant events within the data. There are many practical use cases for this, such as financial transactions and web-based activity, where gathering sets of related activity is required. In my use case, I consider the “significant event” to be a pause of a few seconds in the timeseries to represent the start of a new character (or word).
Further, as with the nearly 700 other in-database functions, we can apply these directly on the data in the Vertica database, and we can do so using simple SQL statements that run against all the data that we need, rather than a down-sampled data set. We have come to expect this sort of capability with Vertica, and that it will perform at great speed.
Before we look at how to use this event-based windows function, let’s consider what we are trying to achieve. We know that our data is made up of a number of rows signified by a series of timestamps, with records appearing once per second. Each row reports the coordinates (latitude, longitude, and altitude) and other metrics (such as direction of travel, speed et al).
We also know that there are gaps larger than a few seconds between each of the characters, and even larger gaps of 30 or more seconds between each of the words. What we want to do is separate them from each other. Then, by visualizing the characters one-by-one we can build the words to which they belong, and by filtering on the individual words, we should be able to decipher the whole phrase.
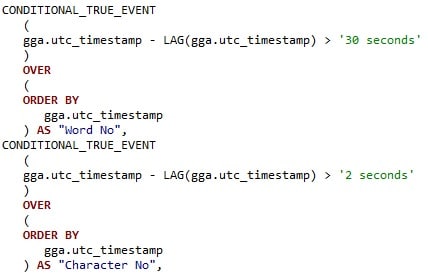
The Vertica CONDITIONAL_TRUE_EVENT analytic function is perfect for this. It assigns an event window number (integer) to each row of the query. This number is incremented by 1 when the result of a Boolean argument expression evaluates to true.
So, we define a Boolean argument expression that tests the difference between two consecutive timestamps. If the difference is just 1 second, we know that we must still be drawing the same letter. If the difference is, let’s say greater than 2 seconds, we must have moved on to the next character, and if the difference is greater than 30 seconds, we have started the next word.
To compare a value in a row (such as our “UTC timestamp”) to the value in the previous row, we make use of Vertica’s LAG function. Here, I am defining two events: one for timestamp differences of over 30 seconds, indicating a new word has been identified, and the other for more than 2 seconds to indicate a new character, as follows:
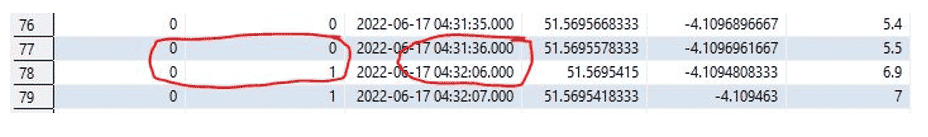
Running this query (of which just a snippet is shown above), we can see the two derived columns “Word No” (i.e., Word Number) and “Character No”, both of which start off with a value of 0. As each of the immediately following rows are just 1 second apart, these two derived columns remain unchanged:

Scanning through the output, we can see that there is a gap greater than 2 seconds (in this example, it looks as though I couldn’t count as I paused for 30 seconds!), but as the Boolean expression of >2 is met, the “Character No” has incremented by 1, but because the other Boolean (>30) was not met, the “Word No” remains at 0:
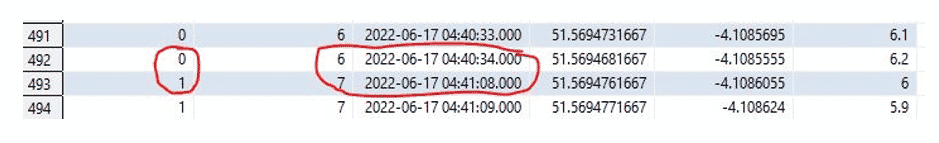
As the data is scanned, we can see that we have already reached the 7th character (remembering we started counting at 0), before there is a gap of 34 seconds which triggers both the “Word No” and “Character No” to be incremented by 1:
What is emerging here?
With the separate characters and words, what does this show us when we visualise the data? Using the two derived columns (“Word No” and “Character No”), I can add these to my Tableau sheet and filter on these one at a time.
Starting with Word 0, Character 0:
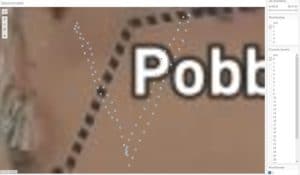
Then add Character 2:
… and expanding to Character 6, we have:

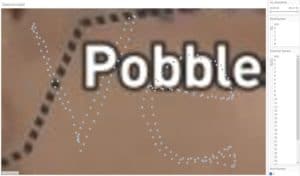
Followed by a CR:
Changing the filter to include all the characters, but restricting the query to just those related to Word 2:
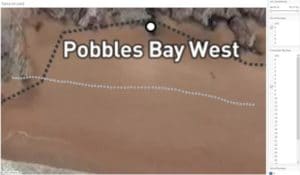
Then Word 3:

And finally Word 4:
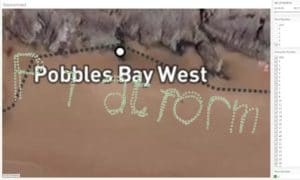
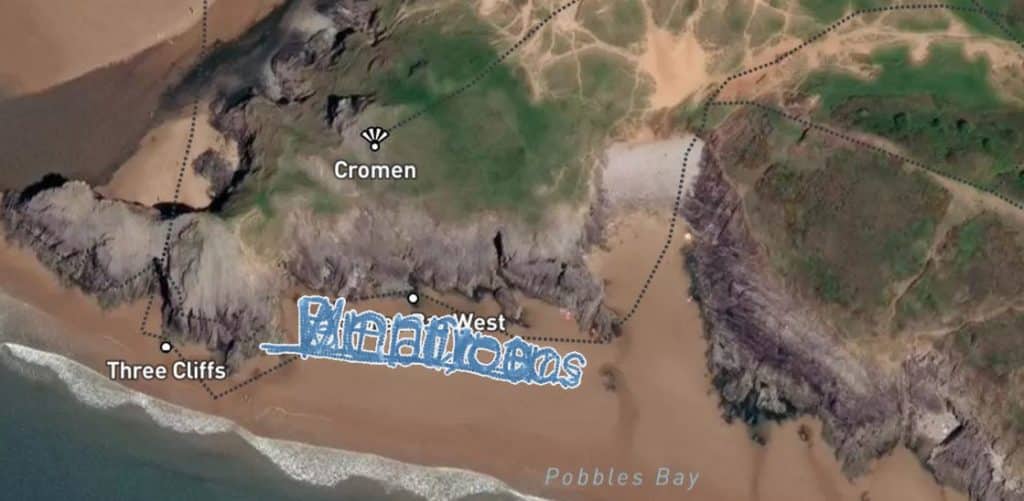
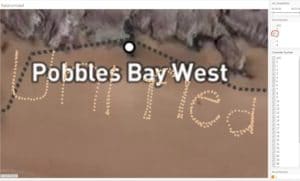
We reveal the four words as:
Vertica Unified Analytics Platform
For those who read the “Take nothing but memories. Leave nothing but footprints” blog post, you may recall what happened to that 1,000 ft piece of graffiti. With the second highest tidal range in the world, my latest masterpiece was very quickly erased. Which reminds me of another piece of history confined to the archives: typewriter correction tape or fluid!
With that incoming tide, it didn’t take long for my words to be washed clean:


Postscript
When I had just completed my masterpiece, and was resting at the top of the cliff waiting for the tide to come in, I spotted someone on the beach. A few minutes later, a lady was climbing the cliff towards me. She said she had climbed up to try deciphering what was written in the sand. Unfortunately, by the time she had reached me, the tide had already come in and it was now totally erased.
Sensing her disappointment, I told her that I was the author, and what I had written.
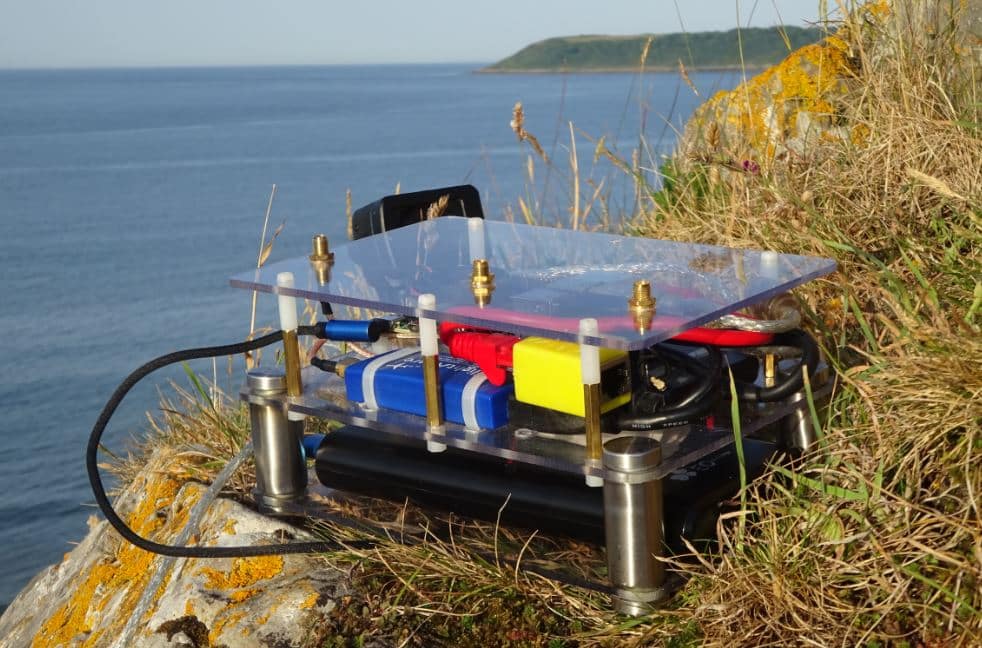
I’m not sure what my next challenge will be with the roaming Raspberry Pi. But see those three screw adapters on the top of the enclosure? These are in preparation for my next hardware additions!
About the Author
Mark Whalley
Manager, Vertica Education
From the early 1980s, Mark worked with Michael Stonebraker's Ingres RDBMS and then a number of column-store big data analytics technologies.
In 2016, he joined HPE Big Data Platform as a Systems Engineer specialising in Stonebraker’s Vertica.
In September 2017 he followed Vertica as it merged into Micro Focus – one of the world’s largest pure-play software companies.
He is passionate about technology and frequently delivers talks at the London, Cambridge and Munich Big Data & Machine Learning Meetups (of which he is the founder with its 4K+ members), the British Computer Society – Advanced Programming Specialist Group, Vertica Forums, the Institute for Analytics and Data Science at the University of Essex et al.
He is a technical blogger and author.