Looking to visualize Vertica metrics in your favorite monitoring tool that supports Prometheus? You can now do it with the Vertica Prometheus Exporter!
We are happy to announce the Vertica Prometheus Exporter, an open-source project now available on Vertica’s GitHub. The exporter uses the vertica-sql-go driver to connect to Vertica.
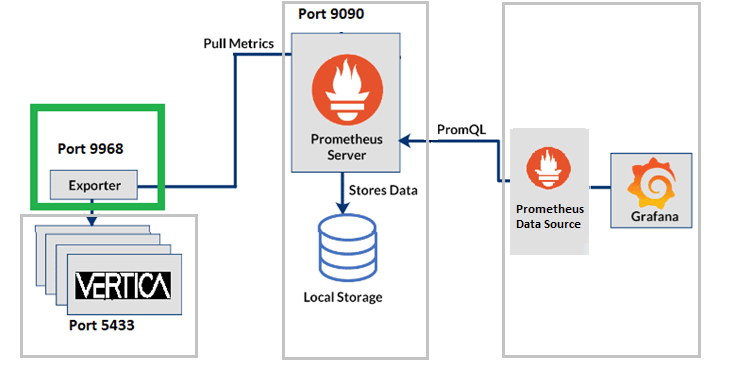
Prometheus is a monitoring system that collects metrics and stores it in a time series database.
With the new Vertica exporter, you can get your metrics from Vertica into Prometheus and use the Prometheus dashboard to display and visualize data as tables and graphs or use a third-party tool that supports Prometheus for a detailed view of your metrics.
These metrics are defined in collector files, and you can easily set up multiple collector files each with its own configuration. So, you can fully customize what metrics you want to collect, the scrape frequency, how to label, whether to cache metrics, and manage visualization. It comes with other features such as verbose logging with adjustable retention, sample collectors, and extensive documentation.
The Vertica Prometheus exporter not only enables you to ingest Vertica metrics into a unified dashboard but also control the number of connections to Vertica and optimize queries for your environment.
Our GitHub page has Exporter related content including the Readme, sample collector files, configurations, tips and techniques, docker builds, and troubleshooting to make best use of the exporter.
We encourage you to contribute to this open-source project by submitting your metrics collector files or enhancements that will help the Vertica community and others who are interested in using the exporter.
In our Knowledge Base, we have a sample solution that explains how you can easily configure Prometheus and connect to Vertica using the vertica prometheus exporter and visualize your data in Grafana Monitoring Solution with Vertica and Prometheus Using Grafana
About the Author
Amrita Akshay
Information Developer