
Median and percentile functions are commonly used data statistic functions. They are also used in other sophisticated data analysis algorithms, such as the robust z-Score normalization function. Vertica has exact MEDIAN and PERCENTILE_CONT functions, but these functions do not scale well for extremely large data sets, because the functions must sort the entire data set to calculate exact values. Sometimes, approximations of the median and percentile are adequate. Vertica 8.1.0 introduced support for two approximate functions:
• APPROXIMATE_MEDIAN
• APPROXIMATE_PERCENTILE
These functions scale well with big data, and are several magnitudes faster than the exact median and percentile functions. Both functions implement the t-digest algorithm proposed by Ted Dunning. The error tolerance of the t-digest algorithm is proportional to q(1-q), where q is the percentile parameter. It is more accurate near the ends of the percentile range.
Vertica engineers made several modifications to the algorithm to handle small data sets and small data groups. The APPROXIMATE_MEDIAN and APPROXIMATE_PERCENTILE functions start with a binary search tree sorting algorithm and switch to the t-digest algorithm to handle large data sets. This avoids the big overhead that t-digest incurs for small data. Most importantly, the t-digest algorithm is implemented in a distributed fashion, which leverages the Vertica Massively Parallel Processing (MPP) architecture. This makes the APPROXIMATE_MEDIAN and APPROXIMATE_PERCENTILE functions very fast.
The following example compares the performance and accuracy of the Vertica built-in approximate median and percentile functions with its exact median and percentile functions.
Generate a Test Dataset with 10 Million Rows of Random Float Values:
=> CREATE SCHEMA mytest;
=> CREATE TABLE IF NOT EXISTS mytest.test1 (id int, f1 float, f2 float, f3 float, f4 float, f5 float, f6 float, f7 float, f8 float, f9 float, f10 float, label int);
\! perl -e 'srand(1); for ($i=0; $i<1E7; ++$i) {$f = rand(1000); printf("%d|%f|%f|%f|%f|%f|%f|%f|%f|%f|%d| %d\n", $i, $f, $f, $f, $f, $f, $f, $f, $f, $f, $f, rand(10));}'| $TARGET/bin/vsql -c "COPY mytest.test1 FROM STDIN DELIMITER '|' DIRECT;"
-- a glance of the data
 id |     f1     |     f2     |     f3     |     f4     |     f5     |     f6     |     f7     |     f8     |     f9     | f10 | label
----+------------+------------+------------+------------+------------+------------+------------+------------+------------+-----+-------
  0 |  41.630345 |  41.630345 |  41.630345 |  41.630345 |  41.630345 |  41.630345 |  41.630345 |  41.630345 |  41.630345 |  41 |     4
  1 | 834.817218 | 834.817218 | 834.817218 | 834.817218 | 834.817218 | 834.817218 | 834.817218 | 834.817218 | 834.817218 | 834 |     3
  2 | 565.489404 | 565.489404 | 565.489404 | 565.489404 | 565.489404 | 565.489404 | 565.489404 | 565.489404 | 565.489404 | 565 |     0
  3 | 187.589517 | 187.589517 | 187.589517 | 187.589517 | 187.589517 | 187.589517 | 187.589517 | 187.589517 | 187.589517 | 187 |     9
  4 | 750.497133 | 750.497133 | 750.497133 | 750.497133 | 750.497133 | 750.497133 | 750.497133 | 750.497133 | 750.497133 | 750 |     3
(5 rows)
-- SELECT COUNT(*) FROM mytest.test1; -- 10 million rows
-- SELECT COUNT(DISTINCT label) FROM mytest.test1; -- 10 classes
The APPROXIMATE_MEDIAN and APPROXIMATE_PERCENTILE return approximate median/percentile values with high accuracy. Compute the Median and Percentile Values of 10 Million Float Values:
-- compute an approximate median on one column (10 million rows)
-- the approximate result is not deterministic
=> SELECT APPROXIMATE_MEDIAN(f1) FROM mytest.test1;
 APPROXIMATE_MEDIAN
--------------------
    500.44373967912
(1 row)

-- compute the exact median on one column (10 million rows)
=> SELECT MEDIAN(f1) OVER() AS EXACT_MEDIAN FROM mytest.test1 LIMIT 1;
 EXACT_MEDIAN
--------------
   500.130526
(1 row)

-- compute approximate percentile 0.1 on one column (10 million rows)
-- the approximate result is not deterministic
=> SELECT APPROXIMATE_PERCENTILE(f1 USING PARAMETERS percentile = 0.1) FROM mytest.test1;
 APPROXIMATE_PERCENTILE
------------------------
       100.057060098426
(1 row)

-- compute exact percentile 0.1 on one column (10 million rows)
=> SELECT PERCENTILE_CONT(0.1) WITHIN GROUP (ORDER BY f1) OVER() AS EXACT_PERCENTILE FROM mytest.test1 LIMIT 1;
 EXACT_PERCENTILE
------------------
      100.0666066
(1 row)
APPROXIMATE_MEDIAN and APPROXIMATE_PERCENTILE scale well when you increase the number of rows, as shown by the following diagram: 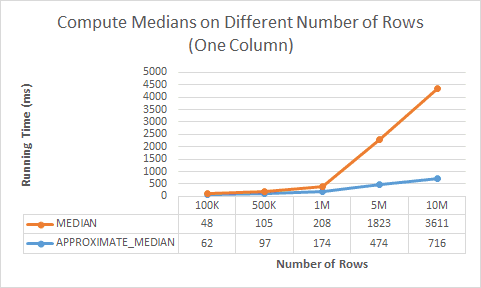
Sometimes, you want to compute median/percentile values of multiple columns in one query:
-- compute 10 approximate percentile in one query (100 thousand rows)
=>SELECT APPROXIMATE_PERCENTILE(f1 USING PARAMETERS percentile = 0.1) APPROX_PCT_10,
       APPROXIMATE_PERCENTILE(f2 USING PARAMETERS percentile = 0.2) APPROX_PCT_20,
       APPROXIMATE_PERCENTILE(f3 USING PARAMETERS percentile = 0.3) APPROX_PCT_30,
       APPROXIMATE_PERCENTILE(f4 USING PARAMETERS percentile = 0.4) APPROX_PCT_40,
       APPROXIMATE_PERCENTILE(f5 USING PARAMETERS percentile = 0.5) APPROX_PCT_50,
       APPROXIMATE_PERCENTILE(f6 USING PARAMETERS percentile = 0.6) APPROX_PCT_60,
       APPROXIMATE_PERCENTILE(f7 USING PARAMETERS percentile = 0.7) APPROX_PCT_70,
       APPROXIMATE_PERCENTILE(f8 USING PARAMETERS percentile = 0.8) APPROX_PCT_80,
       APPROXIMATE_PERCENTILE(f9 USING PARAMETERS percentile = 0.9) APPROX_PCT_90,
       APPROXIMATE_PERCENTILE(f10 USING PARAMETERS percentile = 1) APPROX_PCT_100
FROM mytest.test1 WHERE id < 1E5;

-- compute 10 exact percentile in one query (100 thousand rows)
=>SELECT PERCENTILE_CONT(0.1) WITHIN GROUP (ORDER BY f1) OVER() AS EXACT_PCT_10,
       PERCENTILE_CONT(0.2) WITHIN GROUP (ORDER BY f2) OVER() AS EXACT_PCT_20,
       PERCENTILE_CONT(0.3) WITHIN GROUP (ORDER BY f3) OVER() AS EXACT_PCT_30,
       PERCENTILE_CONT(0.4) WITHIN GROUP (ORDER BY f4) OVER() AS EXACT_PCT_40,
       PERCENTILE_CONT(0.5) WITHIN GROUP (ORDER BY f5) OVER() AS EXACT_PCT_50,
       PERCENTILE_CONT(0.6) WITHIN GROUP (ORDER BY f6) OVER() AS EXACT_PCT_60,
       PERCENTILE_CONT(0.7) WITHIN GROUP (ORDER BY f7) OVER() AS EXACT_PCT_70,
       PERCENTILE_CONT(0.8) WITHIN GROUP (ORDER BY f8) OVER() AS EXACT_PCT_80,
       PERCENTILE_CONT(0.9) WITHIN GROUP (ORDER BY f9) OVER() AS EXACT_PCT_90,
       PERCENTILE_CONT(1) WITHIN GROUP (ORDER BY f10) OVER() AS EXACT_PCT_100
FROM mytest.test1 WHERE id < 1E5 LIMIT 1;
APPROXIMATE_MEDIAN and APPROXIMATE_PERCENTILE scale well when you increase the number of columns. The functions can compute approximate median and percentile values for a maximum of 1600 columns in one query: 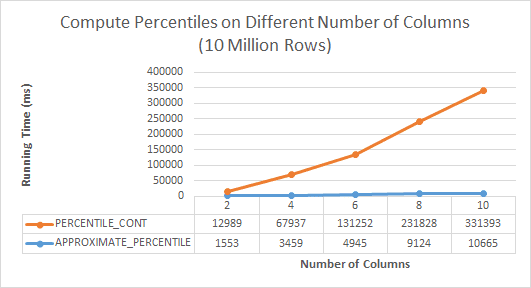
To improve performance of APPROXIMATE_MEDIAN and APPROXIMATE_PERCENTILE statements that contain a GROUP BY clause, create a table or projection that use the same column in their ORDER BY and GROUP BY clause:
-- BEST PRACTICE: ORDER BY the same column of the GROUP BY clause
=> CREATE TABLE IF NOT EXISTS mytest.test2 AS SELECT * FROM mytest.test1 ORDER BY label;
APPROXIATE_MEDIAN and APPROXIMATE_PERCENTILE are aggregate functions that you can use with a GROUP BY clause. The exact MEDIAN and PERCENTILE_CONT functions are analytic functions that use a PARTITION BY window in the OVER() clause. The exact MEDIAN and PERCENTILE_CONT functions might be more efficient in the following case:
-- compute approximate median for each group
=>SELECT label, APPROXIMATE_MEDIAN(f1) FROM mytest.test2 GROUP BY label;
-- compute exact median for each group
=>SELECT * FROM (SELECT label, MEDIAN(f1) OVER(PARTITION BY label) AS EXACT_MEDIAN FROM mytest.test2)foo GROUP BY 1, 2;
-- compute approximate percentile for each group
=>SELECT label, APPROXIMATE_PERCENTILE(f1 USING PARAMETERS percentile = 0.1) FROM mytest.test2 GROUP BY label;
-- compute exact percentile for each group
=>SELECT * FROM (SELECT label, PERCENTILE_CONT(0.1) WITHIN GROUP (ORDER BY f1) OVER(PARTITION BY label) AS EXACT_MEDIAN FROM mytest.test2) foo GROUP BY 1, 2;
Then, you can execute the cleanup commands:
=>DROP TABLE mytest.test1 CASCADE;
=>DROP TABLE mytest.test2 CASCADE;
=>DROP SCHEMA mytest CASCADE;
About the Author
Soniya Shah
Information Developer
Currently, a first year law student with a background in science and technology. Experienced technical writer, with specializations in software documentation, big data, blog development, and website development. I build user-centered content to communicate complex and technical information more easily.
I used to work for Vertica full time for about 3 years. I still work at Vertica part time while going to law school.
Update: Soniya is now doing her law internship, and no longer working at Vertica. Good luck, Soniya!