
For a number of years, when presenting one of my favourite Vertica demos, in which I talk about tracking commercial aircraft in real time, I would typically start with a short, 30-second video clip to get the audience’s attention.

The inspiration for this clip came about when I was staring aimlessly into the blue sky above my home in Pennard (South Wales) watching the condensation trails of aircraft flying high above. I then started to ask myself questions, such as how high were those aircraft flying and at what speed? Where had they flown from, and where were they flying to? What type of aircraft was it, and which airline did it belong to? I was also intrigued as to why I would see more planes flying from west to east in the morning and from east to west in the afternoon?
My curiosity had been stirred and I started to investigate further. There followed a brilliant (if I say so myself) project where I would use Raspberry Pi computers to track these aircraft in real-time, with 100’s millions of rows of data being streamed daily through Apache Kafka into Vertica. From here, I would create visualisations using various BI tools, and demonstrate some of the many brilliant data preparation capabilities of Vertica such as, gap filling and interpolation, one-hot-encoding, sessionisation, and outlier detection to name but a few.
The attention-grabbing video clip showed a single aircraft flying, with a soundtrack taken from Pink Floyd’s The Wall album, where the “Goodbye Blue Sky” track starts with birdsong, followed by a young child saying “Look mummy, there’s an aeroplane up in the sky.”
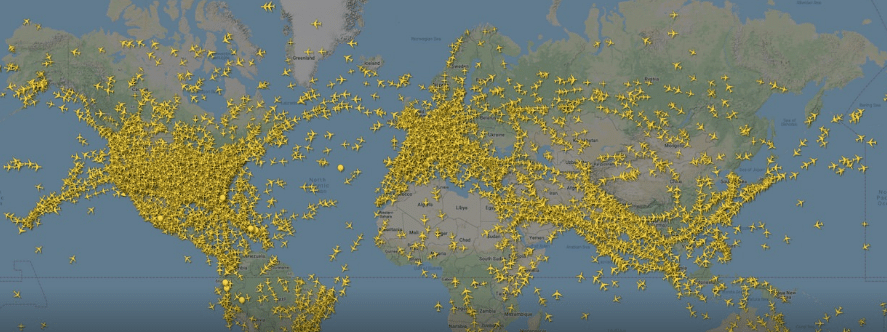
As part of the introduction to the flight-tracking demo, I would illustrate that there wasn’t just a single aeroplane up in the sky, but more like many thousands.
Fast forward to March 2020. More precisely to 06:30 AM on Wednesday 25th March when I was again taking my early-morning walk to set me up for the day.
Today, there were three major differences from that day when I snapped that video clip of the aircraft back in 2013.
Firstly, there wasn’t a single condensation trail from an aircraft in the sky above me, when I would usually expect to see at least ten aircraft at 06:30 AM.

Secondly, there were very few people on the golf course. For me that’s not such a bad thing, as I hate having to dodge the flying golf balls that have gone astray off their intended course when I’m out walking 😉
But the third, and most noticeable thing I observed, was all I could hear this morning was birdsong.
No aircraft noise as they changed track or altitude, no school children running for the school bus, no workers on their way to the office in their cars and no diesel-belching public service buses.
Absolutely nothing to interrupt that beautiful sound of birdsong. Blackbirds, sparrows, wood pigeons and an owl in the distance. A birdsong dawn chorus filling the air.
Why all these differences? As if I need to say, the whole of the planet is being controlled by the effects of Coronavirus (COVID-19). A pandemic that is affecting the whole population. Resulting in actions never seen before (at least in our lifetimes).
Published data on commercial air traffic said it was down by 4.3% in February 2020 compared to 2019, and was reported as down by 10% in March.
But things are moving quickly – in fact VERY quickly. That latest report of commercial air traffic being down by 10% in March 2020 compared to 2019, was reported FIVE days ago.
Five day old statistics are no help to me. I want to know what the current status is. So, as I returned from my walk, I decided to go and check what those Raspberry Pi “radars” were reporting to our Vertica database. With historic data going back to 2017, right up to the latest live-streamed data at my fingertips (OK, up to ~10 seconds ago), I could start to investigate. More importantly, I could have a conversation with my data. Wel,l there was no one else I could have a conversation with at 06:30 AM 😉
Comparing the number of flights spotted over Geneva, JFK New York and Pennard from 1st to 25th March 2019 and the same dates in 2020.
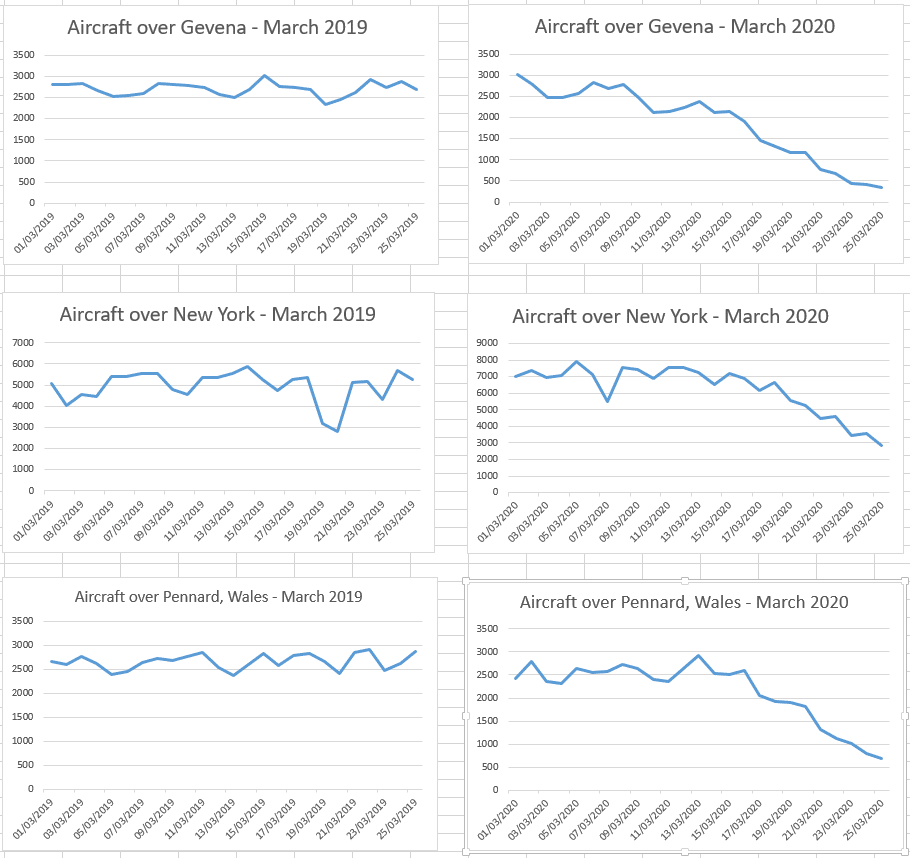
There’s clearly far more than a 10% reduction in traffic.
From a 2019 daily average of 2,698 flights over Geneva, that has dropped to 340 flights on the 25th March 2020 – that’s a reduction of 87%
Pennard, South Wales has dropped by 75% compared to the same day last year.
Whereas New York has only dropped by 42%.
I refuse to get drawn into the politics on this, and am certainly not a scientist or medical expert, but one may ask why it is taking some countries so long to wake up to the seriousness of the current situation.
On the plus side, although my heart and thoughts go out to everyone who is, has or will suffer from this pandemic, hearing that melodic birdsong put a small smile on my face, and set me up for another day working from home.
And a final closing comment. For the naysayers out there, it’s not always raining in Wales!
Take care, and be well.
Mark Whalley
Related External Link:
Stay informed about Covid-19 with your Superset Dashboard – by Eugenia Moreno and Mark Whalley (March 13, 2020)
Related Posts:
Pennard, We Have a Problem – Troubleshooting Flight Tracking with the Grafana Plugin for Vertica
Blog Post Series: Using Vertica to Track Commercial Aircraft in near Real Time — Part 1
About the Author
Mark Whalley
Manager, Vertica Education
From the early 1980s, Mark worked with Michael Stonebraker's Ingres RDBMS and then a number of column-store big data analytics technologies.
In 2016, he joined HPE Big Data Platform as a Systems Engineer specialising in Stonebraker’s Vertica.
In September 2017 he followed Vertica as it merged into Micro Focus – one of the world’s largest pure-play software companies.
He is passionate about technology and frequently delivers talks at the London, Cambridge and Munich Big Data & Machine Learning Meetups (of which he is the founder with its 4K+ members), the British Computer Society – Advanced Programming Specialist Group, Vertica Forums, the Institute for Analytics and Data Science at the University of Essex et al.
He is a technical blogger and author.